
The Growing Appeal of European Equities
European equities have spent the past decade (2014-2024) in the shadow of U.S. and other developed world stock markets. In fact, European stocks lagged most of the large, developed world equity markets by a very wide margin as seen in the table below.
| Security | Currency | Price Change | Total Return |
| S&P 500 Index | USD | 183.94% | 239.95% |
| S&P ASX 200 | AUD | 52.03% | 160.69% |
| Tokyo Stock Exchange TOPIX | JPY | 97.86% | 148.83% |
| S&P/TSX Composite Index | CAD | 68.17% | 128.44% |
| STOXX Europe 600 Price Index EUR | EUR | 48.04% | 107.07% |
Source: Bloomberg (12/30/2014 – 12/30/2024)
As measured by the broad Stoxx Europe 600 index, European stocks generated less than half of the return of the S&P 500 (a leading U.S. index) from 2014-2024. European equities also lagged Japan, Australia, and Canada, by a significant amount as seen in the table above.
Some of the key factors that have caused Europe’s stock markets to underperform include sluggish economic growth, a lack of innovation, a weak banking sector, and Germany’s debt brake. All of these factors collectively acted as headwinds for Europe’s economy. However, many of these headwinds are now turning into tailwinds, which makes us more enthusiastic about the outlook for European equities in the years ahead.
Before we discuss the positive changes, it is worth revisiting some of the headwinds that led to Europe’s underperformance. The Great Financial Crisis (GFC) in 2008-09 is a good place to begin. While regulators in the United States moved quickly to stabilize their banking sector in the aftermath of the GFC, Europe’s path to recovery was very drawn out and filled with turbulence. In the years following the GFC, Europe went from crisis to crisis with several countries and banks flirting with the prospect of a default. Political upheaval including the Grexit and the Brexit, and other similar events also put stress on the system. To make matters worse, this upheaval was compounded by weak economic growth. This was happening at a time when the European Central Bank held interest rates in negative territory for nearly seven years. This put stress on the banking system by depriving them of their ability to generate sufficient net interest income. This in turn, had a negative impact on their willingness to lend. Taking all of this together, we can call it a negative feedback loop that helps to explain why Europe underperformed other parts of the developed world for the last decade.
But at the beginning of 2025, things started to change. Europe went from a laggard to a leader in terms stock market performance among the large, developed world economies. This can be seen in the table below.
| Security | Currency | Price Change | Total Return |
| STOXX Europe 600 Price Index EUR | EUR | 5.76% | 6.52% |
| S&P/TSX Composite Index | CAD | 1.21% | 2.04% |
| S&P ASX 200 | AUD | -4.76% | -3.35% |
| Tokyo Stock Exchange TOPIX | JPY | -4.53% | -3.37% |
| S&P 500 Index | USD | -5.00% | -4.68% |
Source: Bloomberg (12/30/2024 – 03/31/2025)
While there are many questions about the sustainability of Europe’s performance in the first quarter of 2025, we believe there are positive catalysts on the horizon. Looking forward, the region is set to benefit from lower interest rates, fiscal stimulus, and various initiatives related to investments and competitiveness. Furthermore, Europe’s banking system has returned to a healthy position. This is best exemplified by the fact that European banks have been one of the best performing sub-sectors in Europe over the last 2 years. In fact, from 2022-2024 the European Banks sector outperformed all of the large, developed market indices referenced in this piece. This can be seen in the Appendix.
In terms of monetary policy, the European Central Bank (ECB) cut interest rates by 25 basis points to 2.25% in April. This was the seventh interest rate cut in the current cycle and there are further rate cuts expected. Cutting interest rates should provide a tailwind to economic growth, which would potentially boost stock market returns. Europe’s interest rate cutting cycle stands in contrast to the United States where the interest rate cutting cycle has been on pause since January of this year. Inflation has been more persistent in the United States, so the U.S. Federal Reserve Bank has been reluctant to cut interest rates beyond the initial cuts that began last September.
When it comes to fiscal policy, a significant announcement was made in Germany a few months ago. On March 18, 2025, Germany’s Federal Parliament voted in favour of a landmark bill that plans to unlock hundreds of billions of euros for defence and infrastructure projects. The passing of this bill marks one of the largest fiscal policy shifts in postwar Germany given its decision to relax the debt brake. The debt brake was a constitutional fiscal rule put in place in the aftermath of the Great Financial Crisis (GFC). The debt brake limited government borrowing to 0.35% of GDP, which has acted as a headwind towards capital expenditures since the GFC in 2008-09. As a result of the debt brake, Germany has debt levels far below other countries around the world. Germany’s debt-to-GDP ratio is 62%, which compares with the United States at 124%. Given its low debt level, Germany has considerable room to manoeuvre with fiscal policy. From our perspective, Germany’s new-found commitment to fiscal stimulus should mark the beginning of a renewed cycle of capital and infrastructure investment. This is significant given that Germany is the largest country in the Eurozone. We believe that its spending in the years ahead should have positive flow through impacts to other countries throughout Europe.
In addition to monetary stimulus and Germany’s fiscal stimulus bill, several initiatives have been announced in recent years to boost Europe’s economy. The European Commission recently launched a new Competitiveness Compass, an initiative to improve economic growth in the Eurozone focusing on innovation, decarbonisation, and security. In addition, there is also the Next Generation EU program, which is considered one of the largest economic stimulus packages ever financed in Europe. The size of Next Generation EU is approximately €800 billion, which will be invested across many different areas including digital transformation, healthcare, and the green transition. In addition to the Competitive Compass and the Next Generation EU, there is also the European Chips Act. This Act was designed to increase the region’s position in the globally important semiconductor industry.
On top of all the catalysts outlined above, European stocks also trade at a significant discount relative to the United States based on historical levels as seen in the chart below.
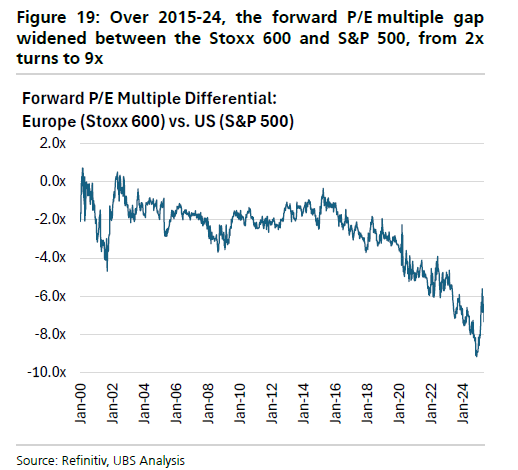
The valuation discrepancy illustrated in the chart above utilizes the price-to-earnings (P/E) ratio. From 2000 to 2016, Europe traded a 2 P/E multiple point discount to the United States. But starting in 2020, the European discount widened significantly and reached a high of 9 P/E multiple points in 2024. Given the rally in Q1 2025 for European stocks, the discount has recently narrowed to about 6 P/E multiple points. However, the discount remains well above the historical average.
In summary, we believe that the outlook for European equities is more promising than it has been in a long time. From our perspective, Europe sits at the centre of a global realignment that has been unfolding over the last few years. This realignment was recently reinforced when the U.S. announced it would withdraw some of its overseas spending on global security. This shift has prompted a significant increase in European government spending, particularly on defence. Looking forward, we believe there are significant catalysts that will provide tailwinds for European stocks in the years ahead. These tailwinds include monetary and fiscal policy, as well as various initiatives that will foster economic growth throughout Europe. We have been positioning our Global and International portfolios to take advantage of the opportunities that lie ahead for Europe.
Appendix
| Security | Currency | Price Change | Total Return |
| iShares STOXX Europe 600 Banks | EUR | 51.01% | 68.02% |
| STOXX Europe 600 Price Index EUR | EUR | 18.82% | 27.16% |
| S&P 500 INDEX | USD | 53.85% | 58.49% |
| Tokyo Stock Exchange TOPIX | JPY | 47.22% | 54.49% |
| S&P / TSX Composite Index | CAD | 27.01% | 35.34% |
| S&P/ ASX 200 | AUD | 17.00% | 29.66% |
Source: Bloomberg (12/30/2022 – 12/30/2024)
Sources:
United States Gross Federal Debt to GDP
https://tradingeconomics.com/united-states/government-debt-to-gdp
Germany’s upper house clears historic defence spending bill
https://www.euronews.com/2025/03/21/germanys-upper-house-clears-historic-defence-spending-bill
German parliament passes historic debt reform, paving the way for higher defense spend
https://www.cnbc.com/2025/03/18/german-parliament-to-vote-on-fiscal-package-that-could-bring-historic-reforms.html
ECB cuts rates for third time this year as Europe braces for Trump tariffs
https://www.theguardian.com/business/2025/apr/17/european-central-bank-cuts-interest-rates-third-time-this-year
European Central Bank cuts interest rates for the seventh time as global trade tensions escalate
https://www.bnnbloomberg.ca/business/international/2025/04/17/european-central-bank-cuts-interest-rates-for-the-seventh-time-as-global-trade-tensions-escalate/


