
November – A month of Thanksgiving and a month to give thanks
November was a great month for many reasons. Not only were global equity markets exceptionally strong, but we also received promising news on 3 separate vaccines with very high effectiveness rates in the 90%+ range. It has been a challenging year but there is light at the end of the tunnel!
During the month of November, the MSCI World Index was up 12.7%. The MSCI World Index is a very broad index which includes more than 1,500 companies across 23 developed markets so it’s a great proxy for what’s going on in global stock markets. The 12.7% gain did not break the all-time monthly record, but it’s pretty darn good when you consider that it’s a larger return than what is typically generated over a 12-month period! The pan-European Stoxx 600 index, meanwhile, notched its best-ever month in November, ending 13.7% higher. The major U.S. indexes also generated strong returns in November with the S&P 500 rising 10.8% and the Dow Jones Industrial Average gaining 11.8%. This was the largest monthly gain for the Dow Jones since 1987. Technology stocks also had a great month with the Tech-heavy Nasdaq Composite Index rising 11.8%.
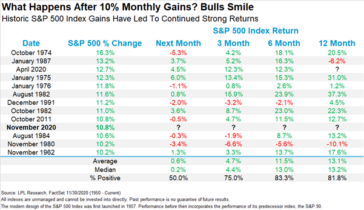
So after an amazing month, what are we going to get for an encore? While nothing is guaranteed, history does paint an encouraging picture. Over the last 60 years, periods of strong market gains have often been followed by further gains as seen in the chart below. According to LPL Financial, following a 10% monthly gain, the S&P 500 is up 83% of the time 6 months later by an average 11.5%. On a 12-month horizon, the S&P 500 is up nearly 82% of the time by an average 13.1% following a monthly gain of 10%.
Over the last 8 months stock market returns have been so strong that they have surpassed the expectations of almost every expert on Wall Street and Bay Street. How can we put this into perspective and how can it be explained? Nobody has the exact answer, but from our vantage point the strong gains can be partly explained by a forward-looking stock market and sidelined cash getting put to work. Notwithstanding a major shock or a vaccine failure, the global economy is set for a significant recovery in 2021 and so the market has strengthened in advance of the recovery. In addition, it also looks as if investors who sidelined trillions of dollars of cash have grown tired of making modest returns in money markets funds and have decided to move into equities.
Following this huge advance in global equity markets, a common question we now hear is “is it too late to get in?”. The answer of course, is, it depends. It depends on who is asking the question, their tolerance for risk, and their investment time horizon. From our perspective, we see an economic recovery and the potential for a sustainable economic expansion driven by a synchronized global recovery.
But what about valuations? Stocks look expensive on several measures that compares them with their own sales, book values, or earnings. However, the yields on U.S. Treasury bonds hit an all-time low earlier this year and remain at levels that most experts would not have predicted 5 or 10 years ago. All else equal, lower interest rates should justify paying more for stocks given that equities can be discounted at a lower rate, making them more valuable.
Recent findings by American economist Robert Shiller shed some light on this subject. Mr. Shiller is well respected on Wall Street given that he famously predicted the Technology meltdown in 2000. He also predicted the 2007 stock market decline that was triggered by the crash in US housing. In a recent publication, Mr. Shiller discusses the surprising resilience of global equity markets in the face of the COVID-19 pandemic. In his piece, he suggests that perhaps investors shouldn’t be so surprised by the market’s resilience. In his opinion, a close look at a measure he calls the Excess CAPE Yield (ECY) puts the long-term outlook for global stock markets in better perspective. The Excess CAPE Yield measure is a useful way to think about long-term valuations for stocks in way that also incorporates the current level of interest rates.
To calculate the Excess CAPE Yield (ECY), one must take the inverse of the cyclically adjusted PE ratio to get a yield and then subtract the ten-year real interest rate. A higher measure indicates that equities are more attractive. The ECY in the US, for example, is 4%, derived from a CAPE yield of 3% and then subtracting a ten-year real interest rate of -1.0%.
According to Mr. Shiller, the Excess CAPE Yield has typically done a good job of predicting subsequent returns over the following 10 years. As seen in the chart below, the Excess CAPE Yield in the US is just slightly below the average of the last 100+ years. According to Mr. Shiller, this suggests that U.S. stocks should generate real returns of approximately 5% per year over the next decade.

Source: Bloomberg
Outside of the US, Mr. Shiller found some very striking results. The Excess CAPE Yield is close to 40-year highs across several global regions and is at all-time highs for both the UK and Japan. The Excess CAPE Yield for the UK is almost 10%, and around 6% for Europe and Japan. China’s ECY is at about 5%. All of these figures indicate that worldwide equities are highly attractive relative to bonds right now.
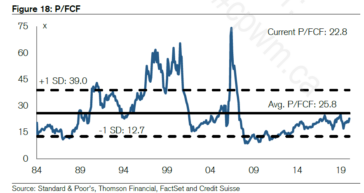
Another measure that suggests that equities are attractive is the price-to-free cash flow measure. Free cash flow is one of the key determinants for valuing stocks so this is a highly relevant measure. As seen in the chart below, the price-to-free cash flow ratio has averaged 25.8x over the last 35 years. This ratio is currently sitting at 22.8x, which implies that the current price-to-free cash flow ratio is 11.6% below the average of the last 35 years.
Taking everything into consideration we remain cautiously optimistic as we approach the end of 2020 and as we look ahead to 2021.
Have a good weekend,
Phil


