2021 First Quarter Global Equities Review
Despite a bout of volatility that emerged towards the end of the quarter, global equity markets finished the first quarter with positive gains. The advance in the stock market was driven by improving economic conditions and progress with COVID vaccinations. During the quarter, the United States generated some of the strongest gains on the back of two overriding themes – greater than expected stimulus and an accelerated vaccine rollout. During the quarter, the S&P 500 generated a total return of 6.2%. This compares with a total return of 4.9% for the MSCI World Index.
The Return to Normality
It has been just over one year since COVID-19 was declared a pandemic and since global stock markets formed a bottom last March. It has been a challenging year but there are more and more signs that the global economy is healing and that everyday life is getting closer to normal. A quick look at the economies where vaccinations are furthest along is a good way to gauge the progress on the world’s return to normality.
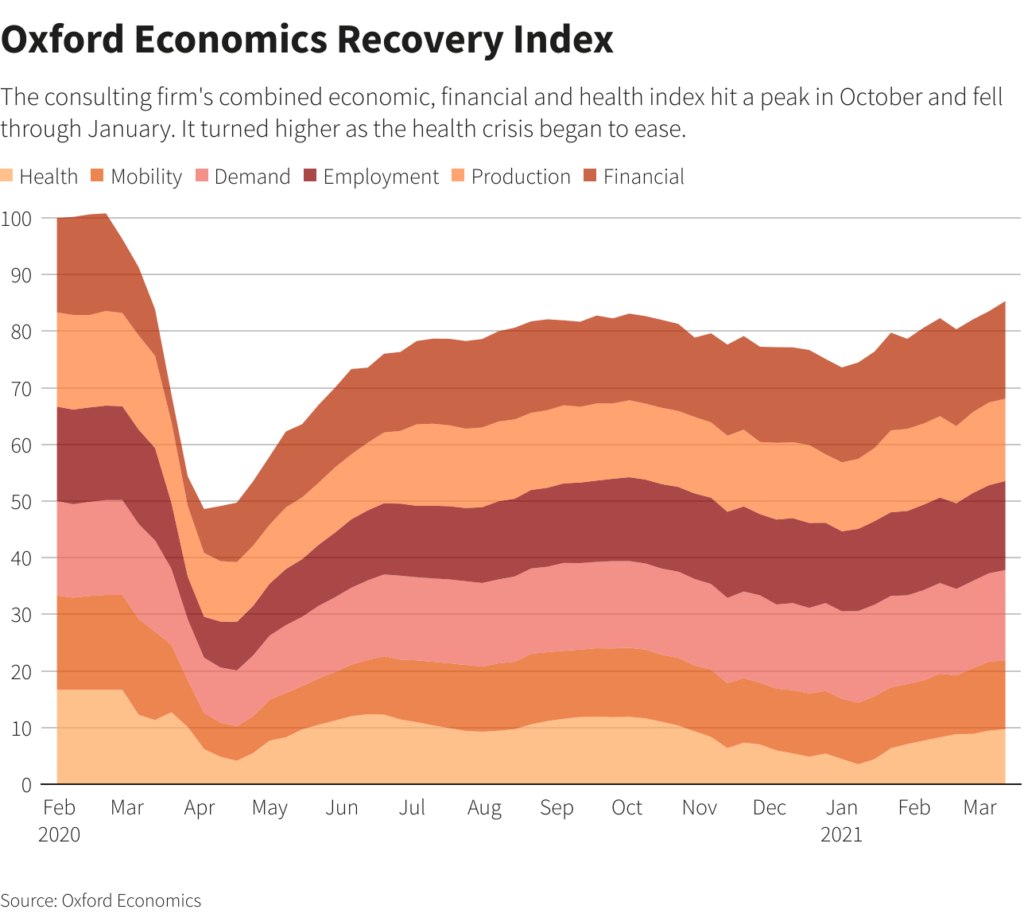
Oxford Economics has an all-encompassing Recovery Index that incorporates several factors including employment, demand, mobility, and health related factors. As seen in the chart below, the Recovery Index has been improving for several months and it is at the highest level since the pandemic began. The Recovery Index highlighted below is for the United States so it is not a perfect readthrough for the world. Having said that, the United States was one of the hardest hit countries by COVID-19 and it is also one of the furthest along in terms of vaccinations, so the progress being made is encouraging.
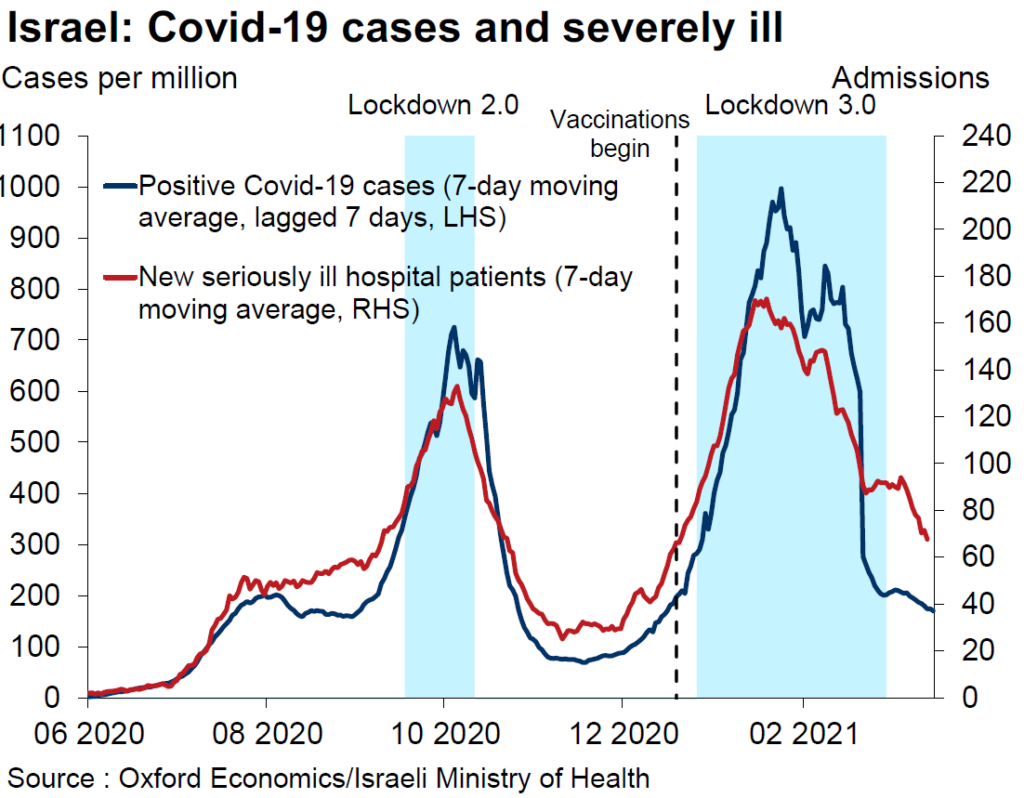
Data from Israel also paints an encouraging picture of the impact of extensive vaccinations on Covid cases and hospitalizations. Israel is another one of the countries that is furthest along the vaccination path with more than 60% of its citizens having been vaccinated. As seen in the chart below, cases of Covid and new severely ill hospital patients have plunged since the first week of February. Given that this occurred during a period when social distancing restrictions were eased, it is a promising sign for other countries as vaccinations begin to ramp up around the world.
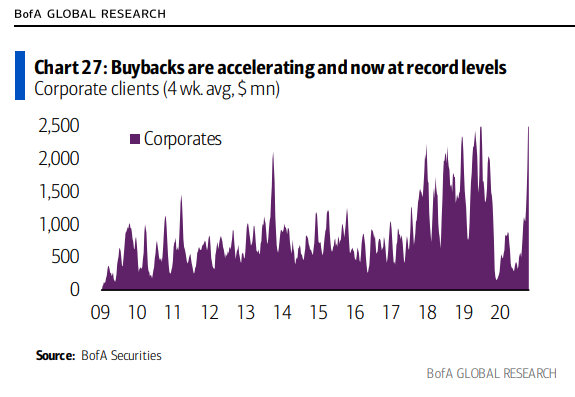
Another sign that we are on the road to recovery is that corporate share buybacks are now back to pre-COVID levels, suggesting that corporations are feeling good about the future.
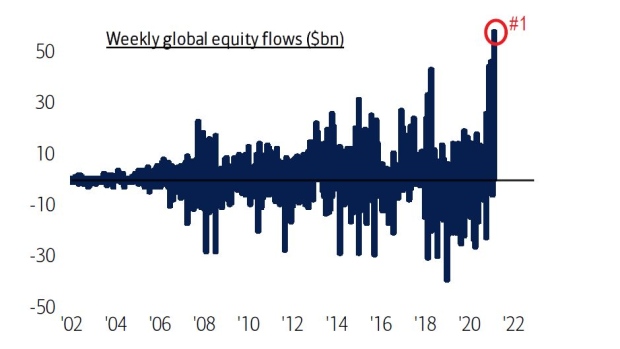
Individual investors are also feeling good about the prospects for the future as inflows into stock funds have reached their highest levels in the last 20 years.
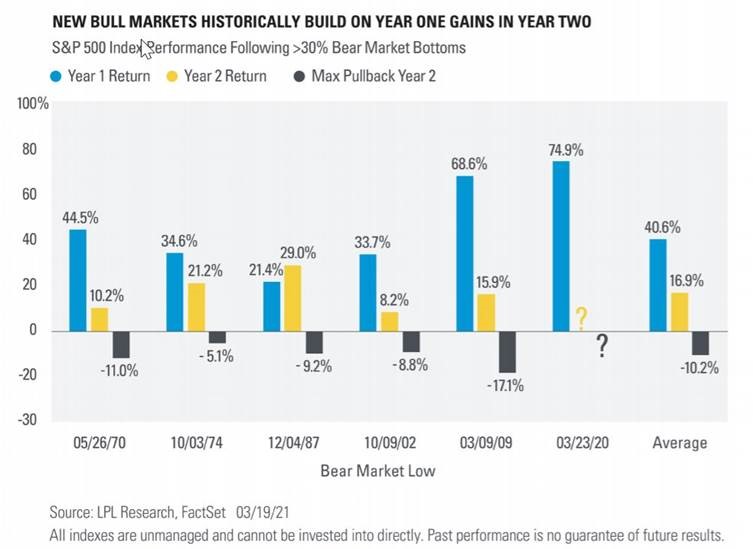
It appears that corporations and individual investors are using history as a guide. According to LPL Financial, the second year of a new bull market has historically been positive. As seen in the chart below, the average return for the S&P 500 in the second year of a bull market has been +16.9% over the last 70 years.
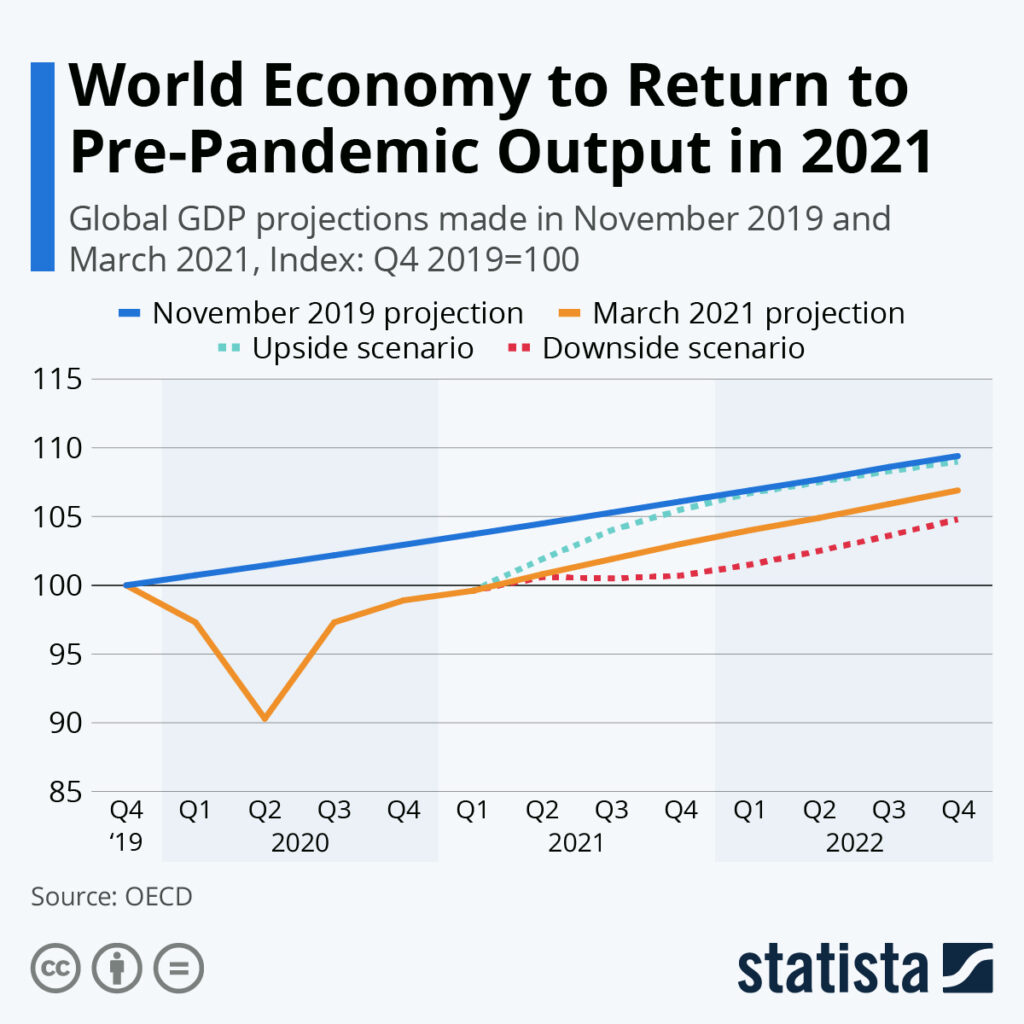
Perhaps the best sign that the world is returning to normal is that global GDP is expected to return to its pre-pandemic level during 2021. This will mark one of the quickest economic recoveries ever.
While it is too early to say that we are completely out of the woods, there are more and more signs that the world is making progress against COVID-19 and that we are getting closer towards a state of normality.
Have a good weekend,
Phil
A Perspective on Volatility and Valuations
Global stock market volatility has increased significantly in recent weeks. Volatility is especially apparent in certain parts of the market such as the Technology sector. The Tech-heavy Nasdaq Index has experienced daily swings of 3-4% in recent days. This has caused jitters among investors. Looking back over the last year, global stock markets are up a lot and they are expensive. But should we be selling? This is a question which many of our clients have recently been asking of us.
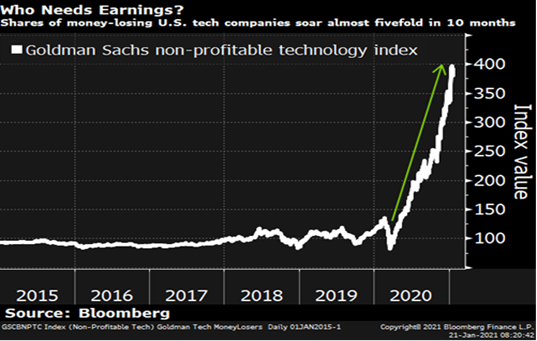
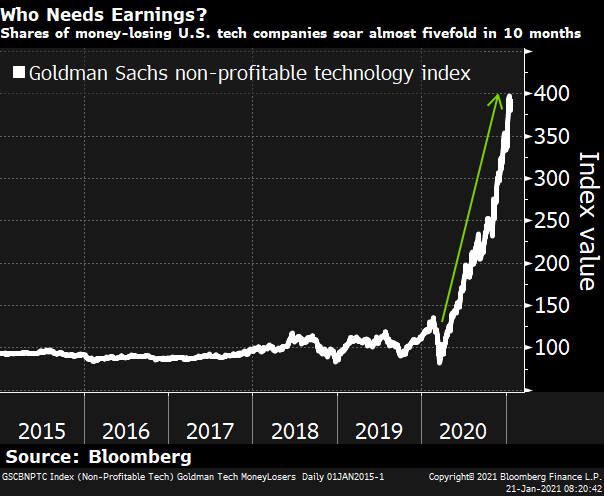
We agree that the stock market is expensive but it’s not across the board. Some areas of the market offer very attractive valuations such as Financial Services. However, some areas are highly speculative and are reminiscent of the Tech Boom in the late 1990’s. Back then, many stocks got so expensive they were being valued on eyeballs. Earnings didn’t matter back then and we are hearing the same narrative today. But earnings do matter, and perhaps that explains why some of the speculative froth has been taken out of the market. The huge advance in non-profitable Tech companies during 2020 (as seen in the chart below) was bound to have a setback at some point.
While stock market volatility creates anxiety, investors should ask themselves if the price action is surprising or out of the ordinary before hitting the panic button. At this point, the moves in the stock market seem quite rational and do not look out of the ordinary. Looking back in history, it is not unusual for stocks to start pulling back when bond yields begin to rise. It’s also not surprising to see high-flying growth stocks bearing the brunt of the selling pressure. Underneath the surface, it appears as though investors are taking profits on speculative growth stocks and using the proceeds to buy stocks within more cyclical sectors that will benefit from the ongoing global economic recovery. This seems rational.
Over the last several months, there have been some huge downward swings within the speculative corners of the market. Several companies have experienced peak-to-trough declines of 30-50%. Examples include Zoom Video Communications which was down nearly 50%, Peloton -40%, Tesla -35%, Spotify -30%, and Shopify which was down nearly 30%. These declines compare with a pullback of about 5% for the S&P 500 and 3% for the Dow Jones Industrial Average Index.
So, should we be selling?
While the market is expensive and there is ongoing speculation in certain areas of the market – we don’t own the market. We own a concentrated portfolio of highly profitable companies that trade at reasonable valuations. One of the lessons from the bursting of the Dot Com bubble is not to get out of the market when speculative activity surges. Rather, the lesson is to avoid the concept stocks with frothy valuations and to be skeptical of unproven companies that claim they are guaranteed to capitalize on exciting new trends.
So, as we navigate today’s markets, in which speculative activity is surging, we will continue to invest in fundamentally sound companies with a proven track record of profitability and only buy them if we can do so at reasonable valuations.
Have a great weekend,
Phil
The implications of rising bond yields for the stock market:
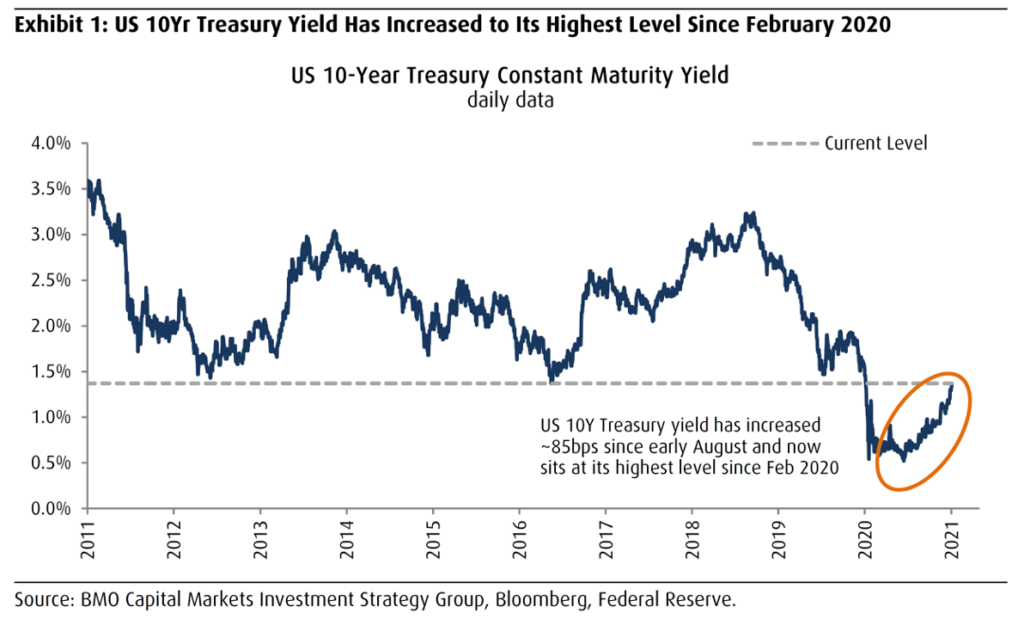
Global stock market volatility has increased in recent weeks and this was especially apparent yesterday when the MSCI World Index fell by 1.5%. The US markets were even more volatile with a decline of 2.5% in the S&P 500 and a drop of 3.5% in the Tech-heavy Nasdaq Index. One of the key factors driving the increase in volatility is the recent spike in bond yields. As seen in the chart below, the US 10-year Treasury Yield has increased to its highest level since February of 2020.
As equity investors, it’s always important to pay attention to what’s happening in the bond market given its track record of providing valuable information for the economy and the stock market.
Our first observation of the chart above is that although yields have spiked, they are bouncing off a decade-low level. And the reason we reached this depressed level is due to COVID. As we all know, COVID led to lockdowns around the world and the deepest recession since the Great Depression. Although hyperinflation is not a concern of ours, there are many signs that inflation could pick up as the global economy returns to normal. One of the most obvious signals is coming from commodity markets. Copper is especially interesting given its widespread application across most sectors of the economy. Doctor Copper is market lingo for this base metal as market commentators like to joke that copper has a “Ph.D. in economics” given its ability to predict turning points in the global economy. Copper is used extensively across various sectors of the economy including homes, factories, electronics, and power generation & transmission. As a result of this, demand for copper is often viewed as a reliable leading indicator of economic health and this demand is typically reflected in the market price of copper.
At a recent price of $4.26, copper is back to levels not seen in a decade, as seen in the chart below.
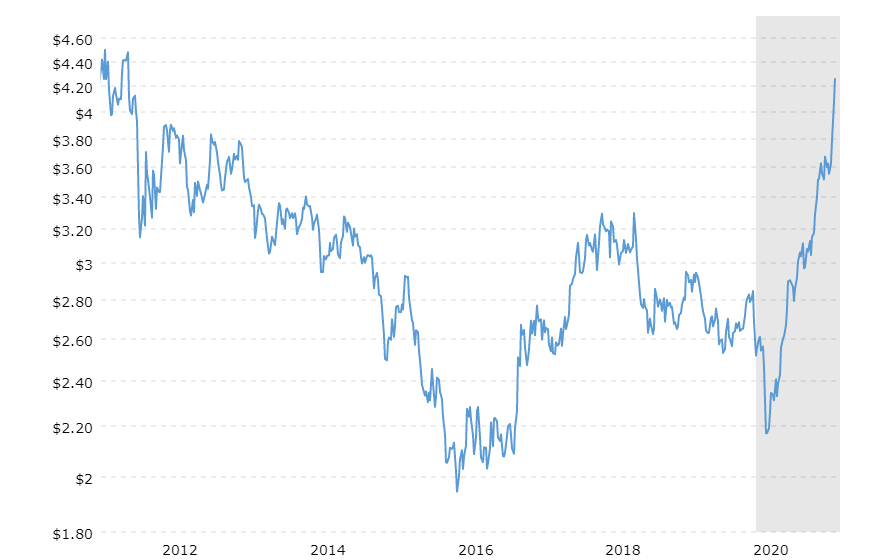
And it’s not just copper that has made a comeback. There has been a significant price move across the commodities spectrum including iron ore, oil, and nickel. From our perspective, the move in commodities is a sign that the global economy is recovering from the COVID downturn. The recent rise in bond yields is another sign that the global economy is normalizing. Given the recent upward move in yields, investors are now wondering if higher interest rates are bad for stocks. This is a legitimate concern given the recent move in bond yields and the expectation that yields will continue to move higher as the global economy recovers from COVID. If stock market history can be used as a guide, equity market investors should not be too concerned about higher interest rates. Over the last 30 years, the S&P 500 has performed better when interest rates are increasing, as seen in the chart below.
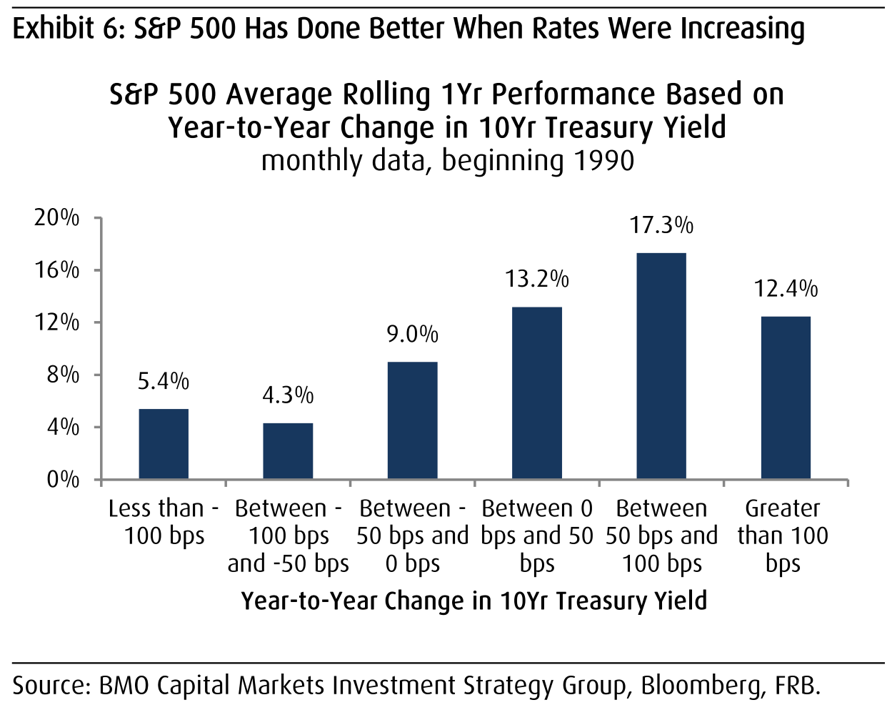
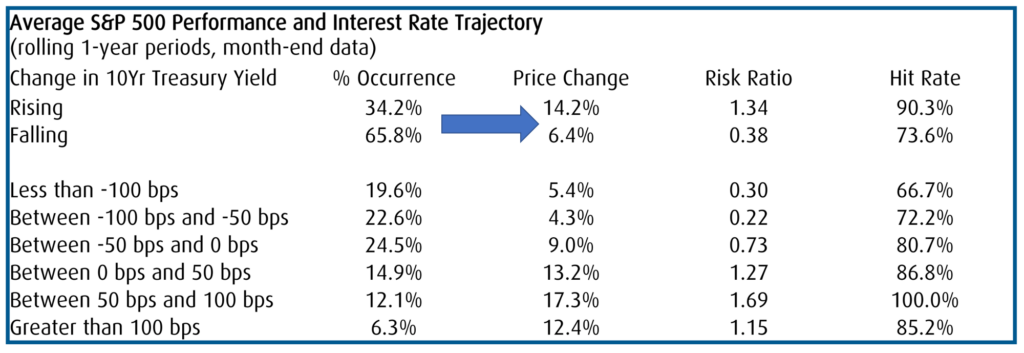
BMO Capital Markets recently analyzed various interest rate cycles over the last 30 years and determined that low levels of interest rates are not necessarily the best environment for US stock market performance. For example, the S&P 500 has generated stronger average returns at higher levels of interest rates compared to lower levels of interest rates. This makes sense because low-rate environments are usually the result of sluggish economic growth. What the analysis shows is that rising interest rates have been good for US stock market performance, especially when rising rates are occurring off a low base as they are today.
Over the last 30 years the S&P 500 has posted an average price return of 14.2% during periods of increasing rates. This compares to an average price return of 6.4% during periods of falling rates as seen in the chart below.
In summary, the recent spike in bond yields has led to an increase in market volatility. However, this pullback should be taken in the context of global stock market indexes that have surged by approximately 70% from the lows in March of 2020. Market pullbacks or market corrections are inevitable given that they happen every year, even during strong bull markets. As we all know, stock markets do not go up in a straight line. While it’s not enjoyable to see a decline in the value of our investments, these stock market sell-offs typically generate attractive buying opportunities. And that’s where our efforts will be focused so that we can take advantage of these opportunities as they are come our way.
Have a great weekend,
Phil
Fourth Quarter Earnings are Plentiful
Our recent commentary focused on potential bubbles in the market. Now it’s time to focus on what really matters for equity markets, which is the earnings being generated from companies that actually make money. While Q4 earnings season isn’t officially over, there are some very positive signs for investors.
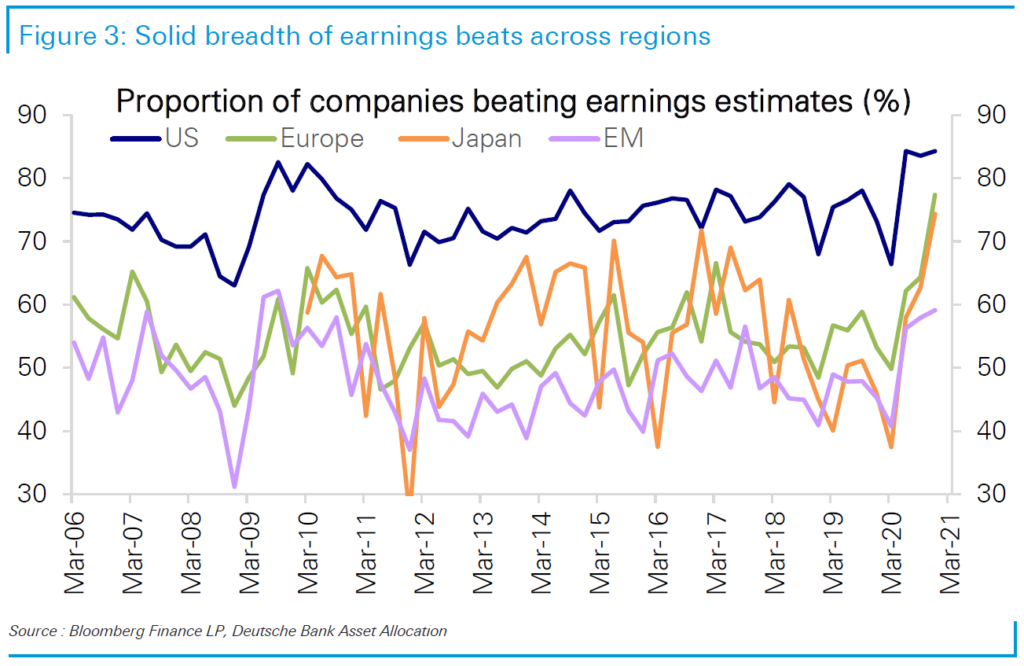
The corporate earnings recovery has been substantially more robust than anyone could have imagined when the pandemic started to unfold about one year ago. Since the COVID crisis began, quarterly earnings have declined on a year-over-year basis throughout 2020. However, on the back of central bank liquidity and government stimulus, earnings growth has turned positive in the fourth quarter. Nearly 85% of S&P 500 companies have reported fourth quarter results thus far. And the results have been nothing short of spectacular. Earnings have surpassed estimates by approximately 17.0% in aggregate, with nearly 80% of companies beating their projections as seen in the chart below.
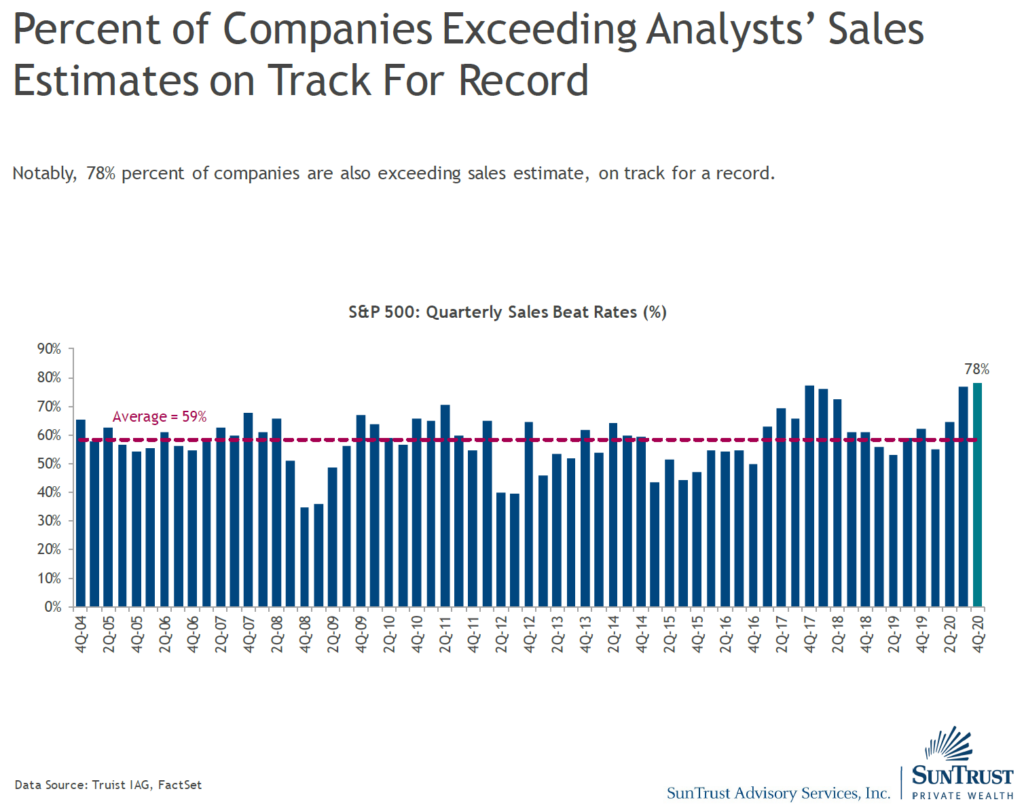
If the current pace continues, Q4 2020 will end up being the second best quarter in terms of positive EPS surprises since FactSet began tracking this metric in 2008. It is important to note that the United States isn’t the only region experiencing robust earnings growth. What we have been observing is broad based strength in corporate earnings across the world. As seen in the chart below, earnings have been surprising on the upside in Europe, Japan, and the emerging markets.
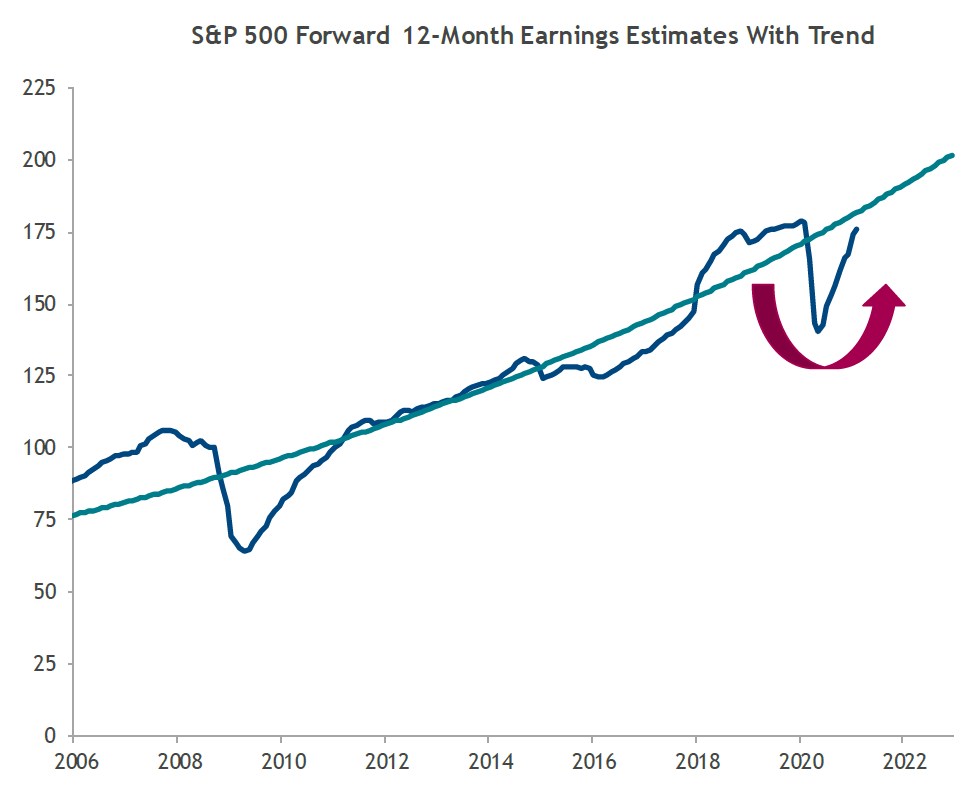
Positive earnings surprises are great to see, but what is even more powerful is when we see positive earnings surprises combined with positive earnings revisions for the future. And that’s exactly what is happening. As seen in the chart below, US corporate earnings revisions have been so strong that we are essentially getting a V-shaped earnings recovery.
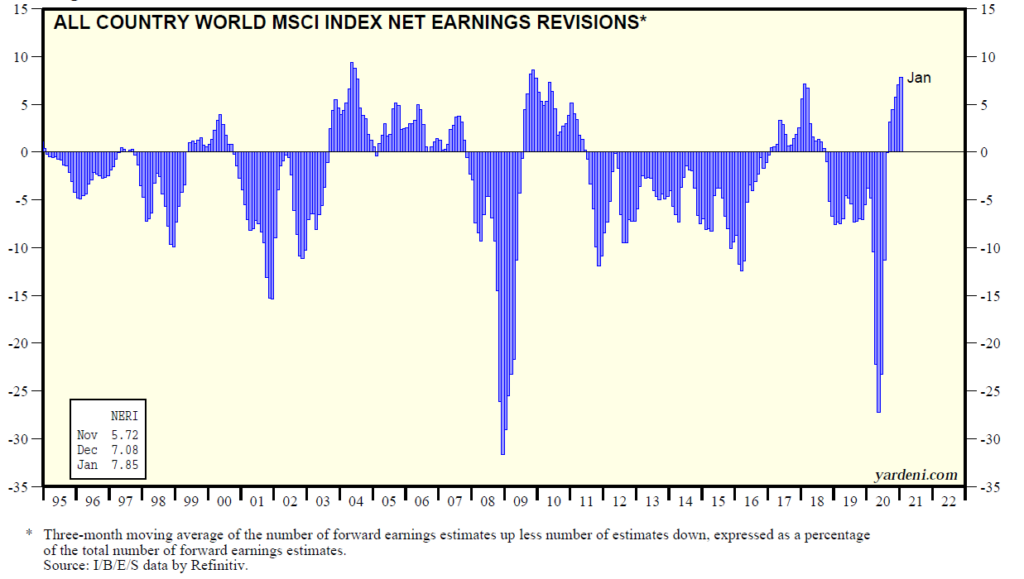
Earnings revisions have also been strong around the world. As seen in the chart below, global earnings revisions are near the strongest levels going back over 25 years.
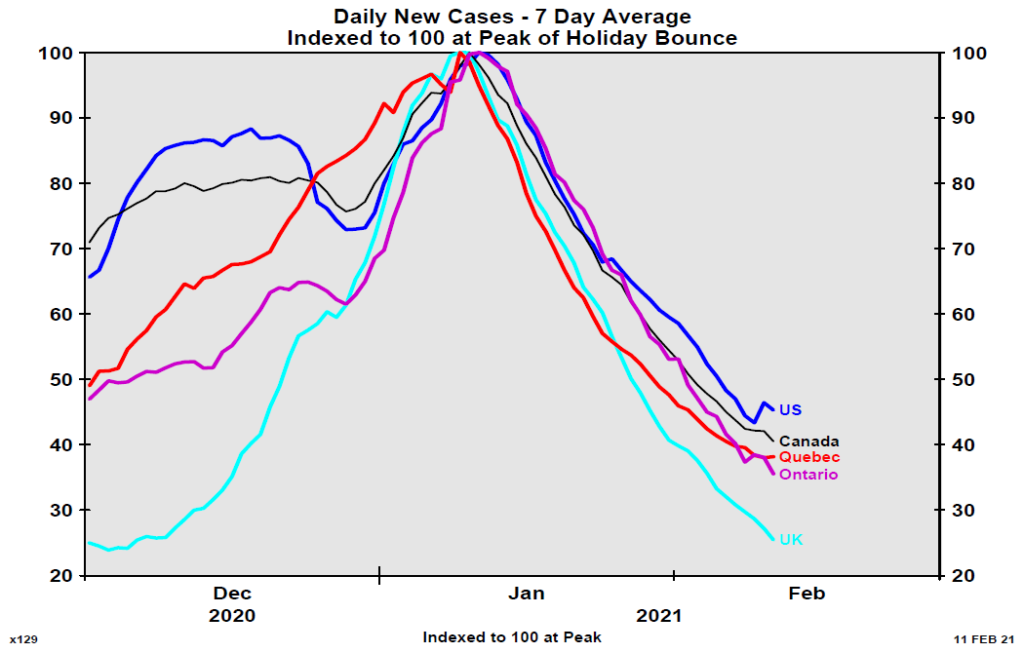
So corporate earnings look solid. And there is also some encouraging news on the COVID front as well. While the data isn’t perfect, recent figures suggest that Canadian and US case counts have fallen by approximately 60% from their peak.
The US has vaccinated about 10% of the overall population. More importantly the highest risk cohorts are getting vaccinated at a rapid pace. With approximately 42% of the 75+ year-old cohort and 24% of the 65-74 age population having already received their first dose, we should start to see mortality rates and hospitalizations plummet. While the vaccine roll-out has been disappointing in other countries (including Canada), the key takeaway is how fast the projected vaccination rates can improve once supply and logistical constraints are overcome. Chile is a case in point. The country was one of the early vaccinators but initially only had limited access to supply of the Pfizer vaccine. This meant it would only be able vaccinate 9% of its population in 2021. It then received 4 million doses of Sinovac and its vaccination run-rate is suddenly the 4th fastest in the world! Good things are happening with earnings and the fight against COVID is progressing. We’ll take it.
Have a great long weekend.
Phil
Partying like it’s 1999: When will the game stop?
The past week has been one of the strangest weeks that we have encountered in a long time. In our previous commentary we discussed ‘potential’ bubbles in Tesla, Bitcoin, and non-profitable Technology companies. There have been extreme moves in all of these areas and 2020 was especially noteworthy for non-profitable Tech companies as seen in the chart below.
It probably makes sense to add Game Stop to the list of ‘potential’ bubbles because we now have retail investors short squeezing hedge funds via Reddit. But who’s David and who is Goliath?
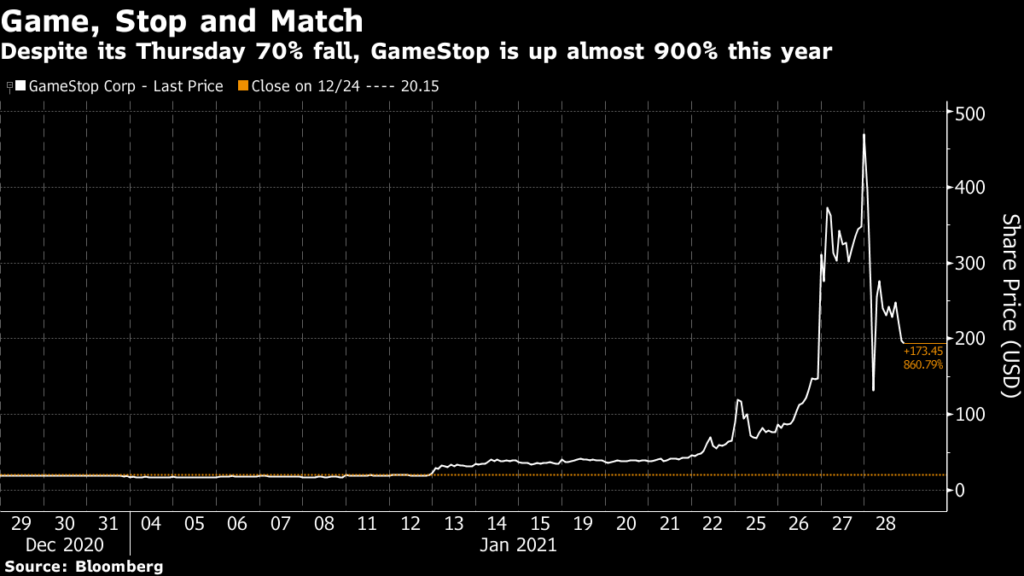
Despite an intra-day drop of 70% yesterday, GameStop is still up nearly 900% this year. In a span of a few weeks, GameStop went from a small cap stock to a mid cap then a large cap stock. At one point it was large enough to be around number 260 in the S&P 500. It seems like speculation to us, but please don’t take our word for it because we’re not experts in the gaming sector.
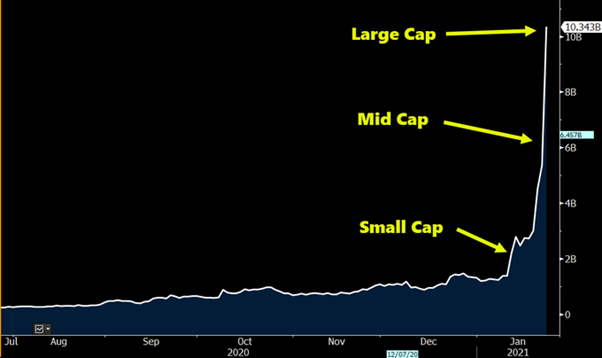
So while we do see some froth in certain parts of the market, that’s not where we are investing our clients’ money so it’s somebody else’s issue to deal with. What this week does show is the magnitude of the firepower that the US retail investor has. Consumer wallets have swelled due to the stimulus and there is more on the way according to what we have heard from President Joe Biden.
Over the last 10 months, there has been a very strong advance in global equity markets as measured by the MSCI World Index, which is up nearly 70% since bottoming in late March. Valuations are currently at the upper end of the range on certain metrics such as the price-to-earnings ratio. Furthermore, investor sentiment measures appear elevated and would imply that investors have become complacent. All of this suggests to us that the market is ripe for some consolidation and we did see a bit of that this week when the S&P 500 declined by 2.5% on Wednesday. Corrections are normal and they happen almost every year, even during bull markets. As seen in the chart below, the average annual drawdown over the last 30 years has been 14.2%.
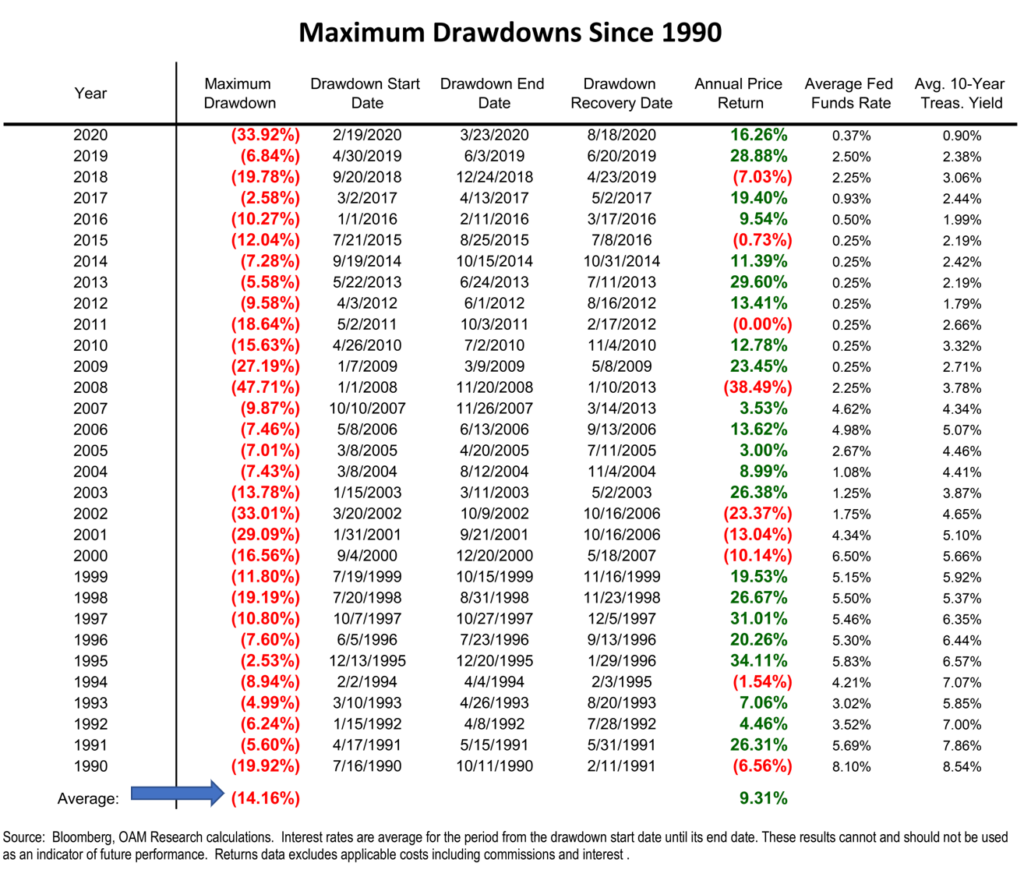
Nobody knows when these drawdowns will occur nor do we know how severe they will be. The important takeaway from this chart is that even though there have been drawdowns of 7% or more in 24 of the last 31 years, the S&P 500 has only experienced a negative annual return in only 9 of those 31 years. And in 2 of those years (2011 and 2015), the market was down by less than 1% so essentially flat. The point is that market drawdowns have typically been good buying opportunities. Not always, but most of the time.
So, what about today’s situation? We believe that a drawdown in 2021 will likely represent a good buying opportunity because we continue to expect a global economic recovery. There are several tailwinds that will support the recovery including government stimulus measures, low interest rates, and a huge amount of pent-up demand from consumers. In addition, Q4 corporate earnings have been strong thus far and have led to earnings upgrades from analysts. And finally, financial conditions remain loose. According to the Federal Reserve Bank of St. Louis, (https://fred.stlouisfed.org/series/NFCI), the current reading of the Financial Conditions Index is near its lowest level of the last 20 years. This implies that there are few signs of stress within the financial markets. Putting it all together, we continue to have a cautiously optimistic outlook for 2021.
Have a good weekend,
Phil
Is The Stock Market in a Bubble?
The stock market has been volatile as 2021 gets underway. After a negative start on January 4th, the market strengthened but it has given back most of the gains in the last few days. This leaves the market up marginally since the beginning of the year. The key issues for investors remain the same and are centered around a global economic recovery. One of the key factors that will drive the recovery is the success of the vaccines that are now being rolled out around the world, which will allow businesses and economies around the world to re-open and resume normal activity.
As we all know, global stock markets have surged since late March primarily on the back of government stimulus. This has provided massive amounts of liquidity, a large portion of which has found its way into stock market. This begs the question, is the stock market in a bubble?
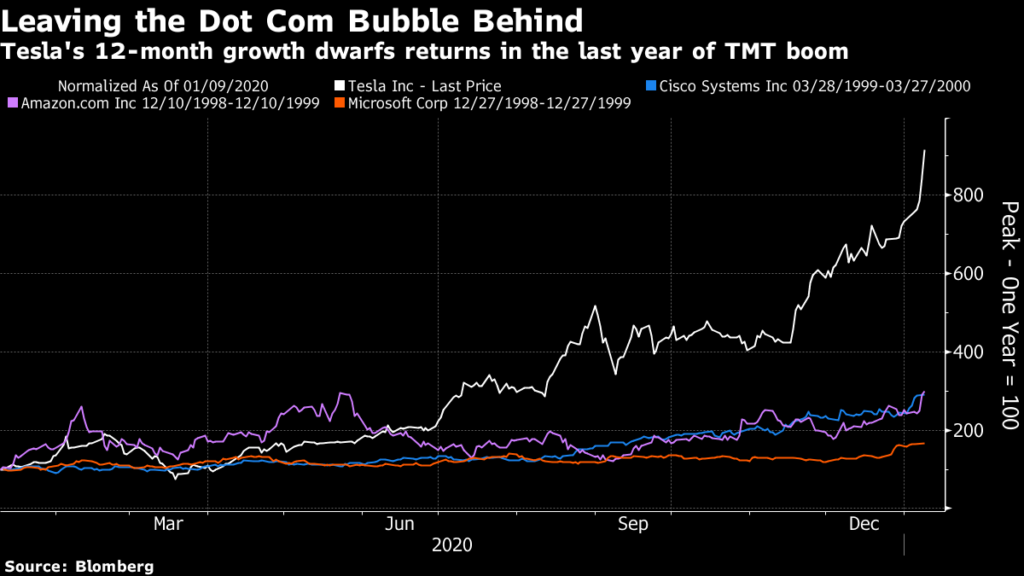
From our perspective, we do see some areas within the market that are concerning. Tesla is a good example with the stock up approximately 1,000% since the March lows! During my career I have seen a few 10-baggers but typically they unfold over several years and sometimes over a decade. I do not recall seeing too many large-cap 10-baggers happen in less than 1 year. As seen in the chart below, Tesla’s 12- month return is well above some of the largest returns that were generated during the Tech Boom in the late 1990’s. This includes Amazon, Microsoft and Cisco.
Another example of a potential bubble is Bitcoin. As seen in the chart below, Bitcoin’s return has been well in excess of other bubbles that occurred in the past. This includes the Tech bubble, the US housing bubble, and the gold bubble.

Finally, we also see a potential bubble within unprofitable Technology companies. Many of these companies are up by 200-300% over the last year despite a lack of profitability.
So Tesla, Bitcoin, and non-profitable Tech are good examples of potential bubbles but does that mean there are bubbles everywhere? We believe it is an exaggeration to say that the entire market is in a bubble. A number of stock market indices generated negative returns during 2020 including the FTSE 100 Index in the United Kingdom (-14.3%), the CAC 40 in France (-7.1%), and the Borsa Italiana in Italy (-5.4%). The S&P 500 was up 16.1% in 2020 but some industry sectors were down during the year including Energy (-37.3%) and Financial Services (-4.1%). These types of returns are not indicative of a widespread bubble formation. We are finding opportunities in various parts of the market, especially in the Financial Services and Healthcare industries. Within those sectors, we see several stocks trading at a 50% discount to the stock market multiple with many companies trading at price-to-earnings ratios of 10-12x on 2021 consensus estimates.
So back to Tesla, Bitcoin, and non-profitable Tech. Why do we say they are in a potential bubble? The interesting thing about bubbles is that you will only know it was a bubble with the benefit of hindsight. Bubbles can go on for years before they pop. Nobody knows how long they will go on for and sometimes what is perceived to be a bubble doesn’t always materialize. Amazon is a good example. And it’s possible that Tesla could keep going up. Having said that, just because a popular stock doesn’t implode and become worthless, it doesn’t necessarily mean that it will be a good investment. Cisco is a good example. If you had bought Cisco Systems during the peak of the Tech boom in 1999-2000, you would still be in a loss position today, 20 years after the fact! The reality in the world of investing is that the price you pay dictates the return you receive. Buying a great company does not always guarantee a great return.
Our clients can rest assured that we are staying away from the areas of the market where we see the risk of a potential bubble and we are spending our time looking for opportunities in areas of the market that have been neglected.
Global Strategy Third Quarter Review
After generating very robust returns during the second quarter, global equity markets continued to climb higher in the third quarter. The key factors that drove stocks higher included improving economic conditions and massive amounts of stimulus provided by central banks around the world. As Q4 gets underway and as we look ahead to next year, the key forces that will impact the stock market include the economy, government stimulus, the US Presidential Election, and COVID-19.
Global Strategy Second Quarter Review
The first half of 2020 is officially over, and it was certainly an eventful period. During the first quarter of 2020, investors witnessed the fastest 30% drawdown in the history of global equities only to be followed by one of the largest 50-day advances in market history during the second quarter. Improving economic data, massive amounts of stimulus, and encouraging news about a potential coronavirus vaccine have been the key drivers behind the stock market’s resurgence.
Global Strategy First Quarter Review
After a very strong year in 2019, and a very strong start to 2020, the global equity markets have sold off very significantly. Unfortunately, the reason for the decline requires no explanation – it is primarily due to the significantly negative economic impact that the coronavirus containment measures are having on the global economy.