Global Equity and International Strategies Third Quarter Review
Despite a bout of volatility that emerged during the month of September, global equity markets finished the third quarter with positive gains. The S&P 500 Total Return Index was up 0.6% while the MCSI World Total Return Index was up 0.1%. Although third quarter gains were modest, global equities have generated attractive returns through the first nine months of the year. On a year-to-date basis to September 30th, the S&P 500 Total Return Index is up 16.8% while the MCSI World Total Return Index is up 13.6%. The advance in global equity markets has been driven by the ongoing global economic recovery and further progress with COVID-19 vaccinations, which has allowed many countries to re-open their economies.
Climbing The Wall of Worry
It’s that time of year when investors get a little bit more nervous than usual. September is historically known as a turbulent month for the stock market and a time when accidents can happen, so to speak. It’s not just a case of seasonality that has investors worried, there are a bunch of different factors that are weighing on their minds. Peak economic growth, peak earnings growth, inflation, the U.S. debt ceiling, Fed tapering, the Delta COVID variant, the efficacy of the vaccines, China’s economic slowdown, Evergrande, and supply chain disruptions around the world. These are some of the concerns, otherwise know as the Wall of Worry.
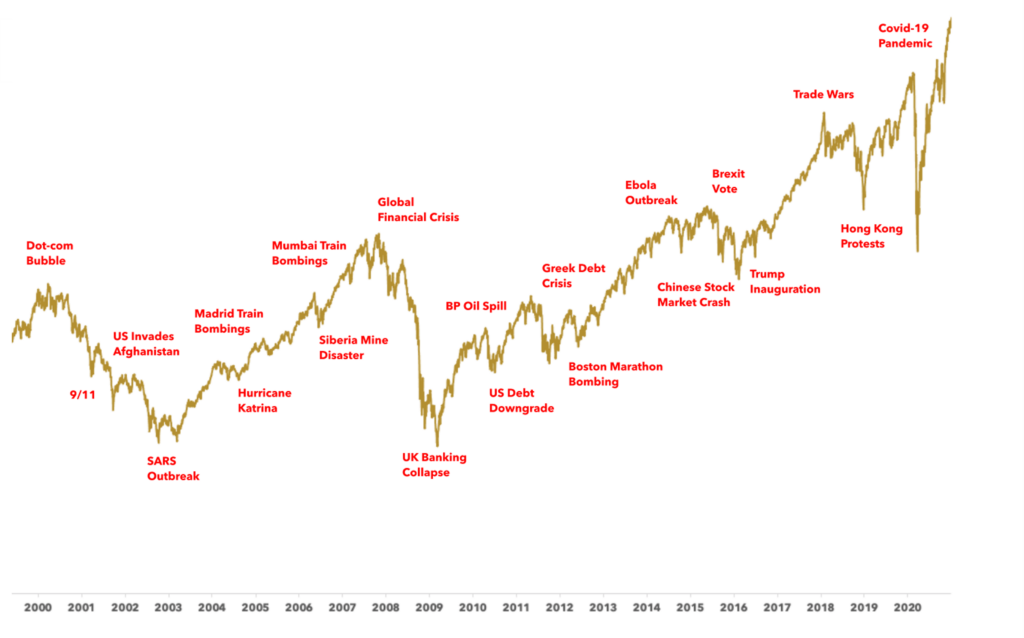
The Wall of Worry refers to a tendency in financial markets for stocks to rise in the face of seemingly insurmountable problems. However, it usually turns out that the problems are temporary and that they are eventually resolved. As seen in the chart below, history is filled with such instances whether it be the bursting of the Dot-com Bubble, the Global Financial Crisis, or the COVID-19 Pandemic.
However, as we all know, the stock market cannot climb the Wall of Worry 100% of the time. Market pullbacks and market corrections are normal, even during Bull Markets. According to Cornerstone Macro, there have been 230 corrections of 5% or more for the S&P 500 since 1928. The average duration of these corrections was 1.8 months and the average decline of these corrections was 11.9%.
The complicating factor about corrections is that nobody can predict when they will happen and nobody knows how long they will last. Having said that, we believe that investors should embrace the next correction, whenever it might happen. From our vantage point, the global economy has a lot of slack remaining from the COVID-induced recession of 2020. We believe that the global economy has more recovering to do and this is especially the case for Consumer Service sectors including restaurants, hotels, and travel related industries.
In addition to an ongoing global economic recovery, investors will soon have seasonality on their side given that the 4th quarter begins next week. According to Ned Davis Research, the median Q4 return for the MSCI World Index since 1970 has been +4.4%. This includes a return of +4.6% during secular bull markets and a return of +4.1% during secular bear markets. Over the last 50 years, the 4th quarter has been positive 83% of the time, which is a higher percentage than any other quarter of the year.
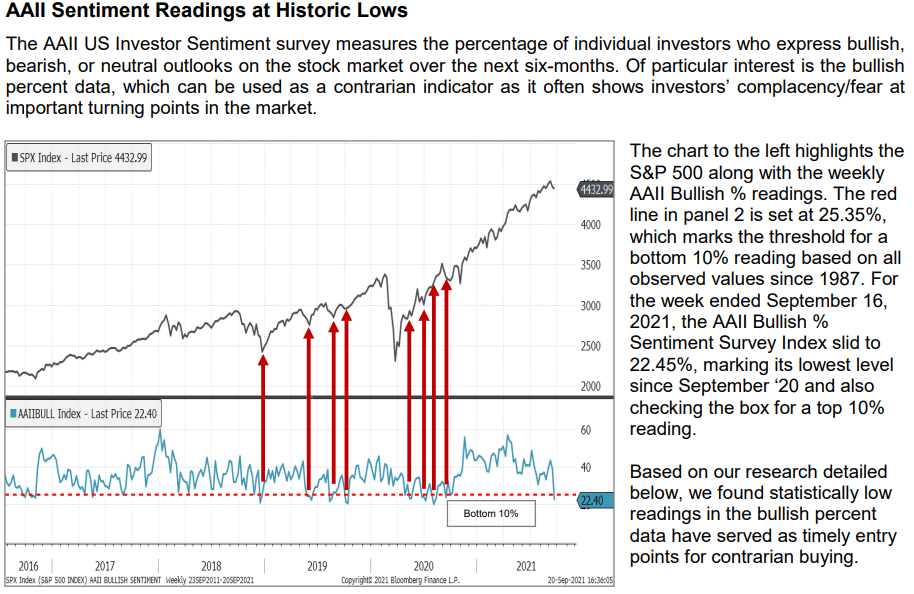
Finally, it’s worth considering some of the various Consumer Sentiment measures. Many of these measures are severely depressed and sometimes this can serve as a contrarian buying signal. For example, the American Association of Individual Investors (AAII) survey is currently at a historic low. According to Piper Sandler and as seen in the chart below, the current survey indicated a reading in the bottom 10% based on all observed values since 1987.
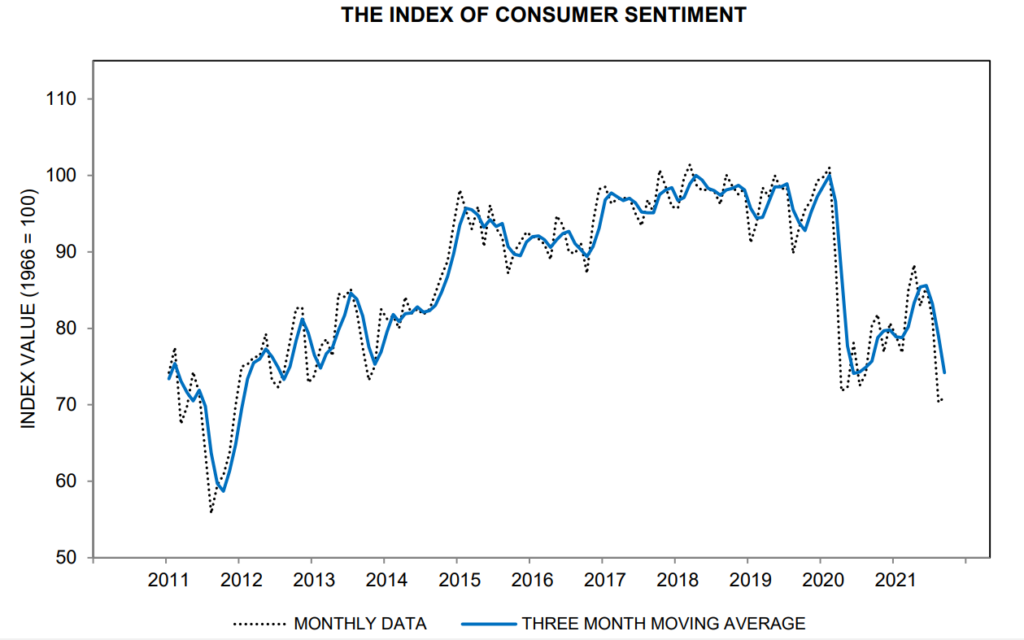
Another consumer sentiment measure is the University of Michigan Consumer Sentiment Index. This index has declined for several consecutive months as the Delta variant and higher inflation appear to have dented consumer confidence. According to Ned Davis Research and as seen in the chart below, the overall index is at its lowest level since December 2011 and in line with the level in March of 2020 during the onset of the COVID pandemic.
These Consumer Sentiment measures indicate that investors are currently very pessimistic. This implies that there is a lot of room for consumer sentiment to improve. At some point this should have positive implications for the stock market. This helps to explain why we believe that investors should embrace the next correction, whenever that might happen.
Have a good weekend,
Phil
The Allure of Emerging Markets
Our global research team has a positive view on emerging markets. Emerging markets make up more than 80% of the world’s population and they generate approximately 60% of the world’s Gross Domestic Product. Emerging markets are appealing to many investors because of their attributes, which include large populations, young demographics, and a rapidly expanding middle class.
Among the various emerging market regions, our team prefers Asia given the opportunities across several countries throughout the continent. China is especially interesting given its large population and the long-term factors that will fuel the growth of its economy. These factors include the rise of the urban middle class, increasing domestic consumption, and the growth of the services economy.
Investing in China has been popular for a long time and there are different ways for an investor to get exposure to China. Some investors prefer to get local exposure by investing in domestically listed companies in China and Hong Kong. This can be accomplished by investing directly in the region or by investing in an American Depositary Receipt (ADR), which are listed on various stock exchanges in the United States. The rationale for investing directly is to get pure play exposure. Other investors prefer to get their exposure by investing in developed market companies that happen to have strong footprints in China. We have consistently leaned towards the latter strategy given that we have a higher comfort level in the accounting and the rule of law for companies headquartered in the developed world.
It has been a difficult period for investors who prefer pure play exposure. Goldman Sachs recently identified a basket of China American Depositary Receipts that has declined by 55% since the middle of February. One of the key reasons for the large decline is related to Chinese regulators who have targeted certain industries, with technology at the forefront. Last November, Chinese regulators blocked the initial public offering of Ant Group. Ant is a sister company of Alibaba, the e-commerce colossus whose founders include billionaire Jack Ma. Since reaching an all-time high last November, shares of Alibaba have fallen by approximately 50%. Internet giant Tencent has seen its shares fall by approximately 40% over the same period on the back of this regulatory fallout. Another example of regulatory interference can be seen with a company called Didi, which is China’s answer to Uber and Lyft. On June 30th, Didi completed an initial public offering that valued the company at $67 billion, only to have Chinese regulators respond fiercely. Didi was ordered to remove its apps from mobile stores and the company is now being subjected to a cybersecurity review. Didi’s shares have fallen by approximately 50% since July.
The regulatory risks in China extend beyond the Technology industry as seen by recent developments in the education sector. In the month of July, China announced sweeping new rules for private tutoring. These new rules created a significant business impact for private education firms as Beijing stepped up regulatory oversight of the industry. Shares of New Oriental Education & Technology Group and TAL Education Group have each fallen by approximately 90% since the new rules were announced last month.
As previously mentioned, we prefer to get our exposure to China through developed market companies that happen to have strong footprints in China. Examples include Estée Lauder and Nike. A brief description of each company follows.
Estée Lauder has a market leading position in the global prestige beauty industry. Prestige beauty is a large and fast-growing industry in China and it includes skincare, make-up, fragrances, and hair care. According to the NPD Group (a leading global information company), China’s prestige beauty e-commerce sales reached $5.4 billion through the first half of 2021. This represents a 47% increase over the same period last year. Estée Lauder first established a presence in Hong Kong in 1961. Today the company employs more than 17,000 people in the Asia Pacific region and it operates more than 400 freestanding stores and thousands of points of sale. For fiscal year 2021, the Asia Pacific region accounted for approximately $5.5 billion in revenue for Estée Lauder or about 34% of the company’s total revenue. Although the company generates a substantial portion of its sales from Asia, it is headquartered in the United States.
Nike has a market leading position in the global athletic footwear and apparel industry. Nike has an exciting opportunity in China given that the government recently announced an ambitious plan to make sports into a $773 billion industry by 2025, a 70% increase from 2019. This announcement falls on the back of China’s success at the Tokyo Olympics where it won a total of 88 medals including 38 gold medals. Nike has operated in China for more than 35 years and the company employs more than 8,000 people directly in its Shanghai headquarters and Taicang Distribution Center. In fiscal year 2021, the Greater China business accounted for more than $8 billion of Nike’s revenue or approximately 19% of Nike’s total sales. Nike’s Greater China business grew by 24% during fiscal year 2021. Although the company generates a substantial portion of its sales from China, it is headquartered in the United States.
In addition to Estée Lauder and Nike, we own several other companies that generate a significant portion of their revenue from China and other emerging markets. These companies include Moët Hennessy Louis Vuitton (luxury), Diageo (alcoholic beverages), and Essilor-Luxottica (eyewear). Like Estée Lauder and Nike, these companies are headquartered in developed countries. In addition to these companies, we also have some investments in companies that are headquartered directly in emerging markets. We have intentionally stayed away from industries where we see substantial regulatory risk and we believe that our exposures are manageable in the context of our global portfolios. When taken it aggregate, the majority of our emerging markets exposure is held through companies headquartered in developed world countries. However, this doesn’t mean we are completely insulated from the risks that exist in emerging markets. Earlier this year Nike went through a period of volatility on the back of a boycott of international brands. The issue was related to Nike’s avoidance of the Xinjiang cotton region and the controversy around forced labour in the region. More recently, we have seen some volatility in Moët Hennessy Louis Vuitton on the back of the backlash against luxury companies and conspicuous consumption in China. While we don’t enjoy it when our companies go through periods of volatility, we believe that the volatility is manageable in the context of our overall portfolio. More importantly, we remain optimistic about the long-term prospects for the companies held across our portfolios.
In conclusion, we prefer to get the majority of our emerging markets exposure by investing in companies that are incorporated in the developed world that happen to have strong footprints in the emerging markets. By embracing this strategy, we believe that we can accomplish three things. We will have more certainty about the sustainability of our investment, we can lower the volatility of our portfolios, and ultimately generate smoother returns for our clients over the long term.
Have a good weekend,
Phil
Sources:
Future Returns: Finding Value in Asian Emerging Markets
https://www.barrons.com/articles/future-returns-finding-value-in-asian-emerging-markets-01629831214
Emerging Markets – Powerhouse of global growth
http://www.ashmoregroup.com/sites/default/files/article-docs/MC_10%20May18_2.pdf
China’s new private tutoring rules put billions of dollars at stake
https://www.reuters.com/world/china/chinas-tal-education-expects-hit-new-private-tutoring-rules-2021-07-25/
China Prestige Beauty E-commerce Sales Increased 47% to $5.4 Billion in the First Half of 2021, Reports The NPD Group
https://www.npd.com/news/press-releases/2021/china-prestige-beauty-e-commerce-sales-increased-47-to-5-4-billion-in-the-first-half-of-2021-reports-the-npd-group/
China Sees Sports as Growth Driver After Its Olympics Success – Bloomberg News
https://www.bloomberg.com/news/articles/2021-08-06/china-sees-sports-as-growth-driver-after-its-olympics-success
Hedge Fund Trend Monitor: Goldman Sachs
The Parallels Between Sports and Investing
Market commentators often like to make analogies between professional sports and the world of investing. Although sports and investing can be very similar in certain regards, they’re also very different. Almost every sport is referred to as a game, but investing is not a game, unless you are day trading meme stocks.
In baseball, the length of a game is determined by innings. But in the world of investing, stock market cycles are measured in years. However, market commentators sometimes like to borrow from baseball lingo when they talk about where we are in the stock market cycle. Given the robust market gains of the last 18 months, investors are probably wondering if we are in the middle innings or the late innings of the current bull market. The thing is, you never really know. It’s only with the benefit of hindsight and the onset of a recession that we know with certainty that a bull market is over.
In football they say defence wins championships. But in the world of investing, determining the winners really depends on where we are in the cycle. If it’s early cycle, then offensively positioned (i.e. cyclicals) portfolios typically generate the best returns. But if it’s late cycle and we’re about to enter a recession, then defensive positioning in one’s portfolio will likely generate better returns than an offensively tilted portfolio.
So why are we using sports analogies in a forum that is supposed to be focused on investing? The reason is that it offers some perspective and it allows us to think a little bit outside of the box given the unusual circumstances of the current environment. In my 20 plus years of investing, I have never seen a global macroeconomic setup like the current one.
On a positive note, we are seeing huge pent-up demand related to the reopening of the economy as vaccines are rolled out around the world. Corporate earnings have been extremely strong and have been surprising on the upside. Furthermore, GDP growth in the United States could hit 7%1 during 2021. I don’t recall a single year during my investing career when the U.S. economy grew by 7%.
On a more cautionary note, this market is running incredibly hot. It is very stimulus driven and it is also deficit driven. For example, the federal deficit in the United States will hit $3 trillion2 in 2021. This represents a slight decrease from last year, but it is triple the level of 2019. This amounts to one of the largest imbalances between federal spending and revenue in American history. Given above average valuations, the stock market is vulnerable to any number of shocks whether it be a new COVID variant or surging inflation that causes Treasury bond yields to rise too rapidly.
The conflicting signals that exist today reinforce our belief in taking a barbell approach when it comes to constructing our portfolios. Looking ahead we believe there is a wide range of outcomes for the global economy. Given the current backdrop, we want to own companies that have both offensive and defensive attributes.
And that brings me to soccer and yet another analogy. A midfielder in soccer is a player positioned in the centre of the field in between the defenders and the forwards. The role of a midfielder is to provide a link between the offensive attack and the defense. The role of a midfielder is not limited to just one job, there are many different dimensions as these players are expected to defend as well as attack. In the world of investing, we can make an analogy between the midfielder and an all-weather stock. An all-weather stock is basically a business that can play offense and defense in the portfolio. Midfielders are high quality companies that have business characteristics that allow them to prosper during economic expansions but also demonstrate resilience during an economic downturn. Many of our Technology and Healthcare holdings play the role that a midfielder plays on a soccer team. For example, the majority of our Technology and Healthcare stocks outperformed the market during the COVID downturn and yet they continued to generate attractive returns during the ensuing economic recovery.
Given the various uncertainties of the current economic landscape, we believe it is prudent as ever to maintain the barbell approach that we use in constructing our portfolios. We own a large number of all-weather businesses and we believe these ‘midfielders’ will protect our portfolios should we enter a more challenging stock market environment. On the other hand, if global equity markets continue to grind higher, we believe that our portfolios are well positioned to participate in the gains that lie ahead.
Have a good weekend,
Phil
Sources:
- https://www.reuters.com/world/us/fiscal-stimulus-vaccines-likely-fueled-us-economic-growth-second-quarter-2021-07-29/
- https://www.washingtonpost.com/us-policy/2021/07/01/cbo-deficit-biden-stimulus/
It is difficult to make predictions, especially about the future
A number of folks employed within the Financial Services industry make their living by making forecasts about the future. Economists, strategists, and portfolio managers spend a significant amount of time trying to make predictions about the economy, the rate of inflation, and how high the stock market will climb in the years ahead.
When it comes to our investment process, we spend most of our time analyzing companies and spend very little time making forecasts about the economy or the stock market. This doesn’t mean that we don’t read the news or that we don’t have personal views on these matters, but we don’t see much value in trying to make projections about macroeconomic variables such as interest rates or bond yields. We prefer to control our overall risk by focusing on the quality of the companies in which we are invested. Instead of making predictions about the macroeconomic environment, we tend to focus on the earnings power, the balance sheet strength, and the sustainable competitive advantages of the companies we own across our portfolios.
As we think about the second half of 2021, we expect uncertainty and volatility to become more pronounced as investors digest the strong gains made by equities during the first half of the year and the potential for new COVID variants. Looking back on the first half of 2021 there was a huge focus by the media on the growth versus value debate. During the first quarter, the yield on the 10-year U.S. Treasury note rose from 1.00% to 1.75% and this became top of mind for market commentators. The abrupt move in the U.S. 10-year yield during the first quarter led to a surge in value stocks across the energy, financial services, and industrial sectors of the stock market. Growth stocks on the other hand, underperformed significantly during the first quarter on the back of the value rally. However, during the second quarter the yield on the 10-year U.S. Treasury note fell from 1.75% to 1.45%. This led to a huge rebound in growth stocks while value stocks underperformed. In a short matter of time the stock market narrative shifted to whether the value trade had run its course. These changing narratives based on 30 to 75 basis point swings in government bond rates are somewhat puzzling to us given that interest rates are simply one factor used in calculating the intrinsic value of a stock.
In recent years there seems to be more emphasis placed on the short term. It appears to us that market strategists and economists are spending an increasing amount of time trying to make predictions about short-term movements in the 10-year U.S. Treasury yield, the US dollar, and the rate of inflation in the economy. These predictions are then used to determine the best trades for investors such as the decision to be invested in value stocks or growth stocks. We don’t try to make predictions about the economy, the 10-year U.S. Treasury yield, or the rate of inflation. The rationale behind this is that we don’t think it is easy to execute an investment strategy based on forecasting the twists and turns of the global economy and then re-adjusting our portfolios accordingly.
We don’t think it is easy to execute an investment strategy based on forecasting the twists & turns of the global economy and then re-adjusting our portfolios accordingly.
One of the problems with making forecasts is that you can be correct in making a prediction but the investment vehicle that is chosen to capitalize on that prediction might not work out. There is an old adage in the investment management industry that portfolio managers don’t have a crystal ball. But suppose they did have a well-functioning crystal ball that could accurately predict the future. Would it help them? Not always. Suppose that on January 31, 2006, you knew with certainty that the price of gold would more than triple over the next five years, from $570 per ounce to $1,900 per ounce. Given that foresight, one might be tempted to invest in Newmont Mining. Buying shares in one of the world’s largest gold producers would appear to be a no-brainer. Yet by 2011, Newmont’s share price ended up at nearly the same price at which it started in 2006. Let’s take another example. Suppose you could know ahead of time which publicly traded companies would make money and which would lose money. A rational investor might be tempted to invest in the former and bet against the latter. Yet in 1999, the stocks of profitable companies barely moved while profitless tech start-up companies soared by approximately 80%. The same phenomenon occurred again last year in the 12 months that followed the market bottom in March of 2020. The price of a basket of Non-Profitable Technology stocks generated a return of more than 400% in 12 months, which was more than 5x greater than the S&P 500 return of 75% during that incredible rebound. Taking it a step further, let’s suppose you could have known the outcome of the 2016 Presidential Election in advance. Knowing that Trump was going to win, many investors would have bet against the stock market by short-selling stocks given that a Trump victory was a very unlikely outcome based on the polls at the time. Investors who bet against the market at that time would have looked smart. For a few hours. On the night of the 2016 election, stock market futures sank rapidly as a Trump victory became increasingly likely. The S&P 500 fell by more than 5% in premarket trading, triggering a circuit breaker to halt trading. However, by the time the market closed the day after the election, the S&P 500 was up by more than 1%. Between 2017 and 2019, the average annual price return for the S&P 500 was over 14%. This happened despite numerous predictions that the stock market would tank in the event of a Trump victory.
We focus our efforts on individual business fundamentals and the factors that will impact the profitability of our companies as opposed to trying to predict the twists and turns of the economy.
At the end of the day, it is difficult to make accurate forecasts about the future. But even if our forecasts prove to be correct, it doesn’t guarantee that we can profit from them as illustrated in the forementioned examples. When it comes to our fundamental research, we focus our efforts on individual business fundamentals and the factors that will impact the profitability of our companies as opposed to trying to predict the twists and turns of the economy. When we analyze companies, our time horizon is measured in years, not in days or quarters. Our focus is on finding wonderful businesses that have a sustainable competitive advantage or a “protective moat” around their business as Warren Buffet likes to say. We want to own companies that operate in industries with high barriers to entry. These types of companies typically earn above average returns on invested capital for extended periods of time and it enables them to generate sustainable earnings growth. We believe that sustainable earnings growth is a key driver of stock price appreciation over the long term. In summary, our research efforts are focused on identifying high quality companies so that we can invest in them for the long term and let them compound in value for the benefit of our clients.
We hope that everyone is enjoying their summer.
Phil
Sources: Forbes and O’Higgins Asset Management.
Global Equity and International Strategies Second Quarter Review
Global stock markets continued to rise during the second quarter with the S&P 500 increasing by 8.2% and the MSCI World Index rising by 7.3%. On a year-to-date basis the S&P 500 is up 14.4% and the MSCI World Index is up 12.2%. The year-to-date return for the S&P 500 is the 2nd best first-half performance since 1998. The best first half return since 1998 was generated in 2019 when the S&P 500 increased by 17.4% in the first six months of the year. The robust stock market returns of the last six months have been driven by strong economic data as the global economy continues to reopen helped by COVID-19 vaccinations and trillions of dollars of fiscal stimulus. The handsome year-to-date gains are on top of the attractive gains that have been generated since the market bottomed in March of 2020 with the S&P 500 and the MSCI World Index both up more than 80% over the last 15 months.
Is the Recent Uptick in Inflation Transitory?
Based on our recent conversations, it is apparent that there is a major debate going on with regards to the rate of inflation and the sustainability of it. As seen in the chart below, inflation has soared in recent months and this has created some concern for investors.
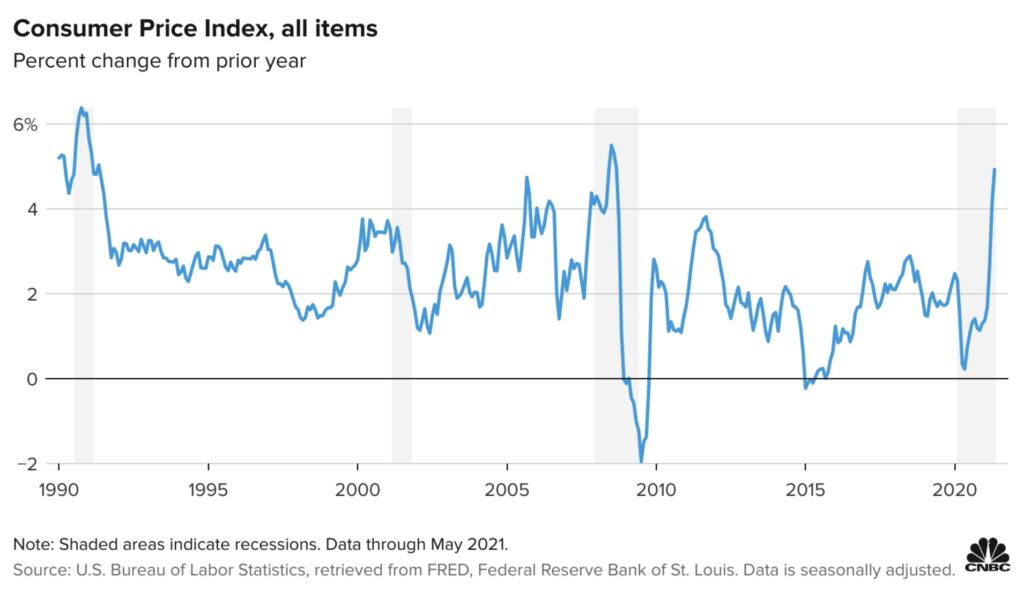
During the month of May, the Consumer Price Index (CPI) rose by 5% compared to one year earlier. This was above the 4.7% rise that was forecasted by Economists and it marked the largest increase in the CPI since August of 2008. The Consumer Price Index is a closely watched measure and it represents a basket of goods including food, energy, housing costs, and sales across a spectrum of goods.
The key question as it pertains to this recent bout of inflation is whether it will be long lasting or whether it will be more transitory in nature. There are good arguments to be made for both cases and it is possible that both scenarios will prove to be correct over time. In the short term, there are good reasons to believe that inflation will remain stubbornly high. However, over the medium and long term these inflationary pressures should subside.
From our vantage point, the recent uptick in prices that is being felt by both businesses and consumers is largely driven by transitory disruptions that have occurred across various supply chains. These supply chains include food, semiconductors, oil, lumber, copper, shipping containers, and trucking. The supply shocks that are happening are an outcome of several factors that can be tied to the pandemic response. In the early stages of the pandemic there was a series of shutdowns that affected businesses across a wide range of industries. These shutdowns were made not only due to concerns about falling demand but also public safety measures that were implemented to contain the spread of the COVID virus. In hindsight, the magnitude of the shutdowns proved to be far too pessimistic. The shutdowns significantly underestimated the speed at which vaccines would get approved and the resulting rebound in demand. As a result of this, the demand side of the economy has rebounded faster than expected and the supply side of the economy has not been able to ramp up production fast enough to satisfy this demand. This helps to explain why we are now experiencing a spike in inflation.
It’s easy to see why there is an ongoing debate about inflation. The inflation bears can point to certain corners of the market that have already started to simmer down. Take lumber, one of the biggest gainers among commodities over the last year as Americans poured money into home remodeling. The price of lumber has collapsed by 40%1 since its peak in May. The booming U.S. housing market has also cooled as measured by building permits, which are a forward-looking indicator for home sales. For the month of May, building permits fell by 3.0%2 to just under 1.7 million units. This represented a seven-month low and the decline was widespread across regions and property types. Copper is another commodity that has eased from an all-time high. However, the inflation bulls can point to the numerous areas of the economy where supply constraints remain and torrid demand have left prices at multi-year highs. The answer to the inflation debate is that it can probably be found somewhere in the middle.
The hope that inflation will remain low forever and that interest rates will remain near zero forever seems unrealistic. This is especially the case given the communication that came out of the Federal Open Market Committee meeting this week. In a nutshell, The Federal Reserve raised its expectations for inflation this year and brought forward the time frame on when it will next raise interest rates.
On the other hand, we believe there is a low likelihood that the global economy will return to the high levels of inflation that occurred during the 1970’s and the 1980’s. The rationale behind this line of thinking is that there are several counter-inflationary secular trends that exist in the world today with Technology at the forefront of these trends. Technology acts as a counter-inflationary force in the global economy in several ways. Automation and robotics on the factory floor have improved productivity and lowered the cost of manufacturing. The rise of Ecommerce and the Internet has led to greater price transparency. This has resulted in greater price competition and has squeezed out high-cost producers across a number of global industries. Demographics is also a secular trend that provides a counter inflationary force for the global economy. The world is aging, people are living longer, and they are having fewer children. As people get into their 60’s and 70’s, they tend to spend less and become more frugal. An economy with aging demographic trends is likely to grow more slowly and generate less inflation.
So how should investors protect their portfolios given the prospects of rising inflation and higher interest rates? We believe that investing in high quality companies is the best way to insulate our portfolios given the expectation of higher inflation and rising interest rates. High quality companies typically operate in industries with high barriers to entry. This makes it difficult for new competitors to enter the market and typically enables the incumbents to earn above average returns on invested capital for extended periods of time. It also means strong pricing power and very stable cash flow generation. These attributes will protect them as the global economy transitions to a higher inflationary environment. In terms of higher interest rates, it means increased borrowing costs and reduced cash flows for highly indebted companies. High-quality businesses are somewhat insulated from this given that they are characterized by robust financial strength and consistent free cash flow generation. This reduces their dependence on debt capital and the negative impact to their earnings from higher borrowing costs.
In summary, we do believe that inflation will remain elevated in the near term but we do not believe that we are entering a period of substantially higher inflation like what was experienced in the 1970’s and 1980’s. Furthermore, we believe that our portfolios are very well positioned for the current environment given the high quality attributes of our investments.
Have a good weekend,
Phil
- Factset Data
- 2.CNBC
The Transition to Mid-Cycle
Despite recent bouts of volatility global equity markets continue to be resilient. The MSCI World Index is up 9.4% on a year-to-date basis and it is up 4.7% on a quarter-to-date basis. These are very attractive gains especially if they were converted into annualized figures. As we all know by now, the global economy has recovered from the COVID-induced recession at a much faster rate than what was originally expected. Global equity markets have reacted accordingly with the MSCI World Index up more than 80% from the bottom that was established in March of 2020. So where do we go from here?
Based on various observations, we believe that the global economy has transitioned from early cycle to the mid-cycle stage. In the year that followed the stock market bottom (March 2020), global equities exhibited classic early cycle behaviour. The factors that led the stock market during the first year of the recovery were very typical and included small caps stocks and equities with high betas, high leverage, and low quality. The sectors that outperformed were textbook early cycle winners and included retail, autos, materials, semiconductors, home builders, banks, and transportation. On a historical basis, the early stage of the economic cycle can last up to two years. However, in the current cycle the early cycle phase was much shorter than usual given the V-shaped nature of the global economy recovery. The recession of 2020 was a different kind of recession given that it was triggered by a global pandemic. It was not caused by the typical factors that cause recessions such as overheating or asset bubbles. This is very important because the consumer and global corporations went into the recession from a position of strength. This is one of the key reasons why the global economy generated a V-shaped recovery and one of the fastest economic rebounds in history. It’s also why we have transitioned to mid-cycle at a quicker pace than previous cycles.
Some of the signs that lead us to believe that we have moved beyond early cycle include the recent underperformance of small cap stocks, a rebound in quality stocks, and a sharp decline in highly valued stocks. As measured by the Russell 2000, small cap stocks have underperformed the S&P 500 by more than 10% since March. High quality stocks which lagged significantly in the first year of the new bull market have recovered substantially over the last 2 months. Finally, some of the speculative high-flying stocks have experienced sharp declines over the last several months. This includes stocks such as Peloton, Teladoc, and Tesla, just to name a few.
What should investors expect during the mid-cycle phase of the current economic cycle? While we expect economic growth to remain robust, we do expect more volatility in the stock market and an increase in inflationary pressures. This will lead to rising bond yields and eventually interest rate hikes from central banks around the world. This typically leads to a contraction in the Price-to-Earnings ratio for global stock markets. This may sound like bad news on the surface. However, what it likely means is more volatility but still positive gains for the global equity markets.
Looking back at previous market cycles can provide some context. In both 2003 and 2009, the S&P 500 generated substantial gains as the economy exited the recession. After the large snapback rallies, the S&P 500 moved to a choppier phase in 2004 and 2010 as seen in the chart below.
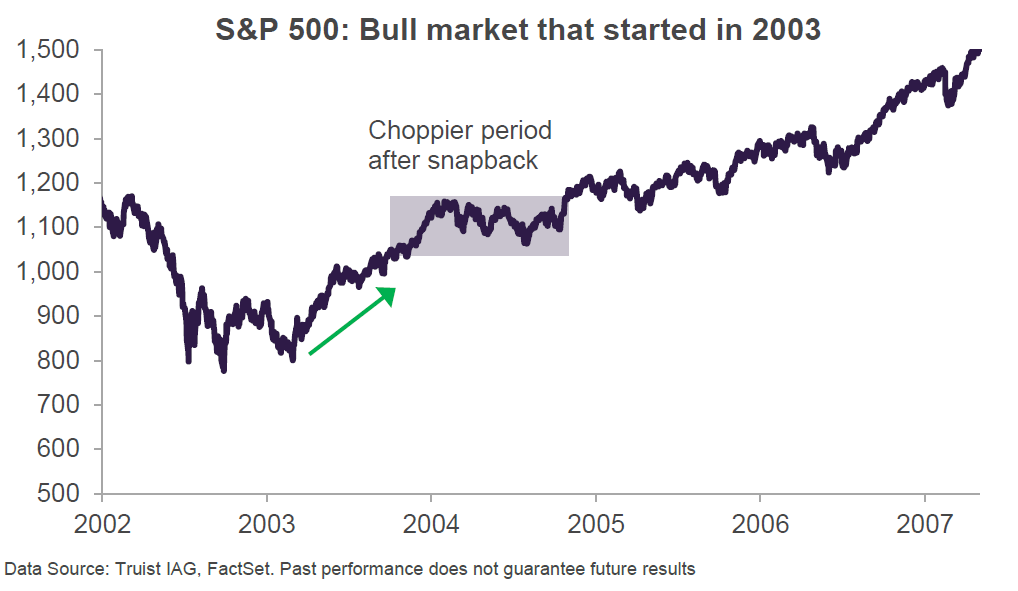
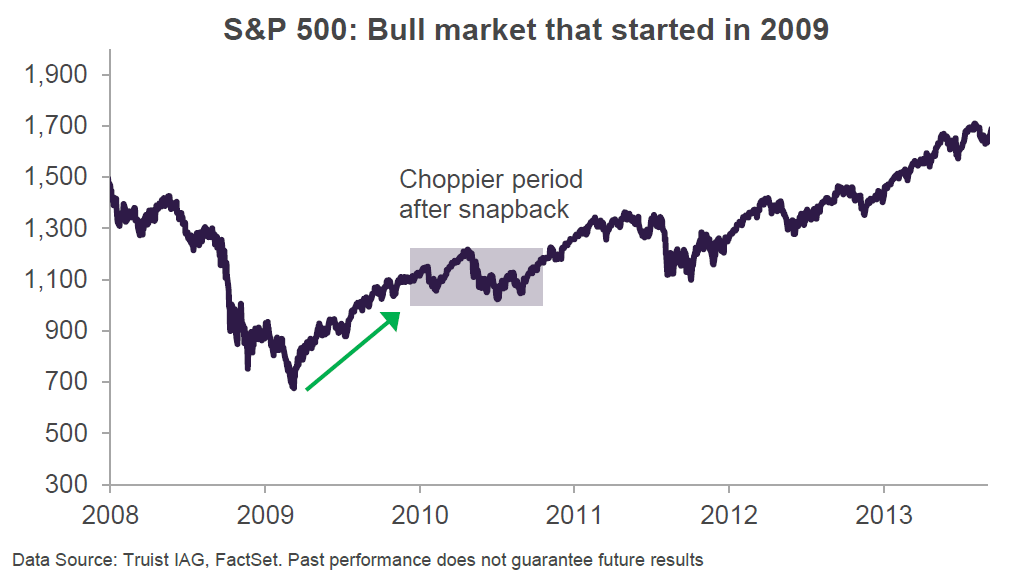
2004 and 2010 marked the second years of those respective bull markets. Despite the choppiness that ensued in both periods, the bull market in both time periods still had several years remaining. Although it is reasonable for investors to expect more volatility, stock market gains have typically been positive during the second year of a new bull market as seen in the chart below.
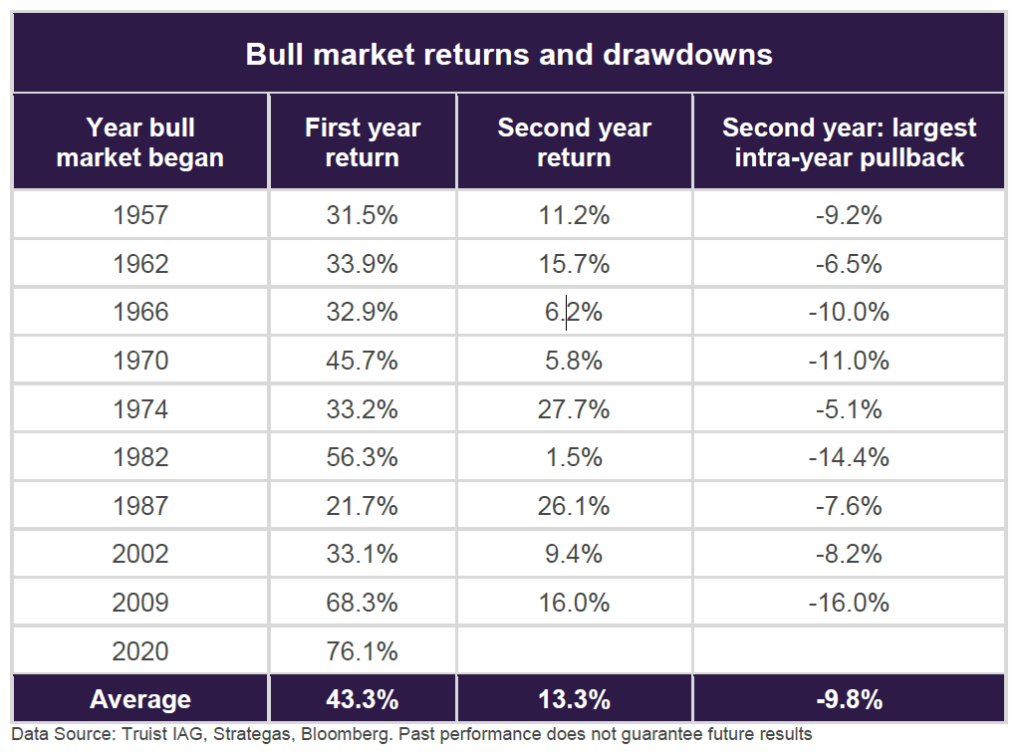
Based on data going back to 1957, the S&P 500 has generated an average return of 43.3% in the first year of a new bull market. During the second year of a new bull market the average return was 13.3%.
So how should investors position their portfolios for the mid-stage phase of the economic cycle? Given the expectation for rising inflation, we believe it is important to invest in companies with strong pricing power. These types of companies will be very well positioned as they can pass along rising input costs. Companies with pristine balance sheets will also be well positioned as they will be insulated from the impact of higher interest payments associated with rising interest rates. In addition, we believe it is important to avoid companies with elevated valuations. In an environment where Price-to-Earnings multiples are compressing, it is of paramount importance to avoid companies with unreasonable valuations. Our portfolios are constructed with high-quality companies that are highly profitable across the business cycle. The companies we own are resilient and many of them emerged from the COVID pandemic in an even stronger position than they were previously. Furthermore, our companies hold leadership positions in attractive industries which gives them strong pricing power. This will protect them as the global economy transitions to a higher inflationary environment. Our companies also have strong balance sheets and we believe they trade at reasonable valuations. In summary, we believe that our portfolios are very well positioned for the mid-stage phase of the economic cycle.
Have a good weekend,
Phil
A Perspective on Earnings Revisions and Pent-Up Demand
Global equity markets have continued their upward trajectory over the last several weeks. During the month of April stocks were particularly strong with the S&P 500 up 5.3% and the MSCI World Index increasing by 4.7%. The strong gains are being driven by optimism around prospects for a strong post-Covid economic rebound fueled by pent-up demand and unprecedented levels of monetary stimulus. The global vaccine roll-out is also providing a boost to the recovery and helping consumer confidence. On the back of the large gains in the stock market, concerns around valuation have begun to surface more frequently. Although these concerns are valid, there are some factors to consider.
During the early stages of an economic recovery, stocks typically appear expensive on valuation metrics such as the PE ratio (Price-to-Earnings ratio). During economic recessions corporate earnings become depressed and this causes valuations to look expensive. This has occurred during previous recessions and was particularly noticeable during the downturns of 2001-2002 and 2008-2009. This phenomenon is especially pronounced for the Trailing 12-month PE ratio as seen in the chart below. The various spikes in the blue line (the Trailing 12-month PE ratio) illustrate this point.
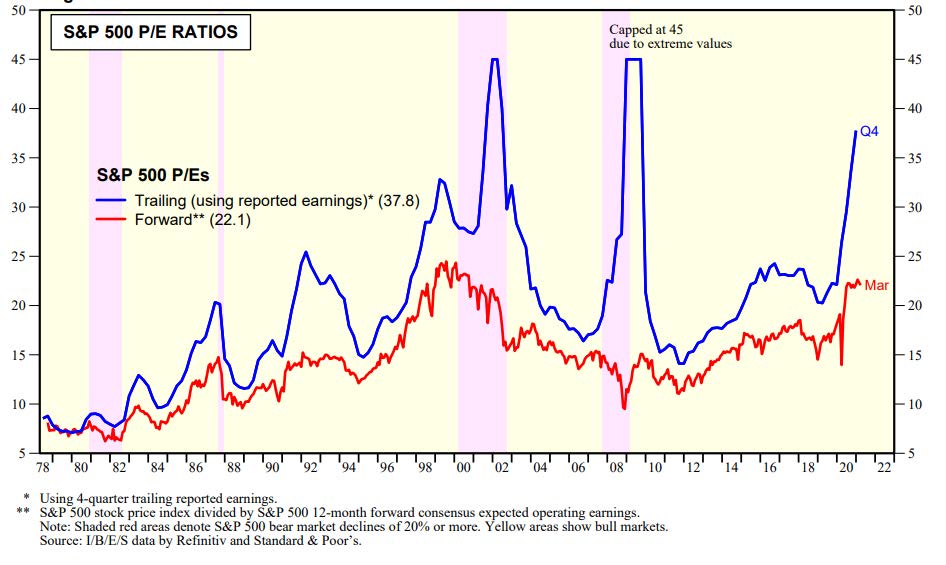
Although the trailing 12-month PE ratio is helpful, it is a backward-looking indicator. In our view the 12-month forward PE ratio is more meaningful as it provides information about the future. This metric is represented by the red line in the chart above. The 12-month forward PE ratio is currently elevated and is above the long-term average. We would be concerned by this metric if we looked at it in isolation and assumed all else equal. However, one must consider the level of earnings revisions. One of the reasons we remain cautiously optimistic about global equities for 2021 is related to the magnitude of positive earnings revisions. As seen in the chart below, positive earnings surprises for the S&P 500 are at their highest level in the last 35 years.
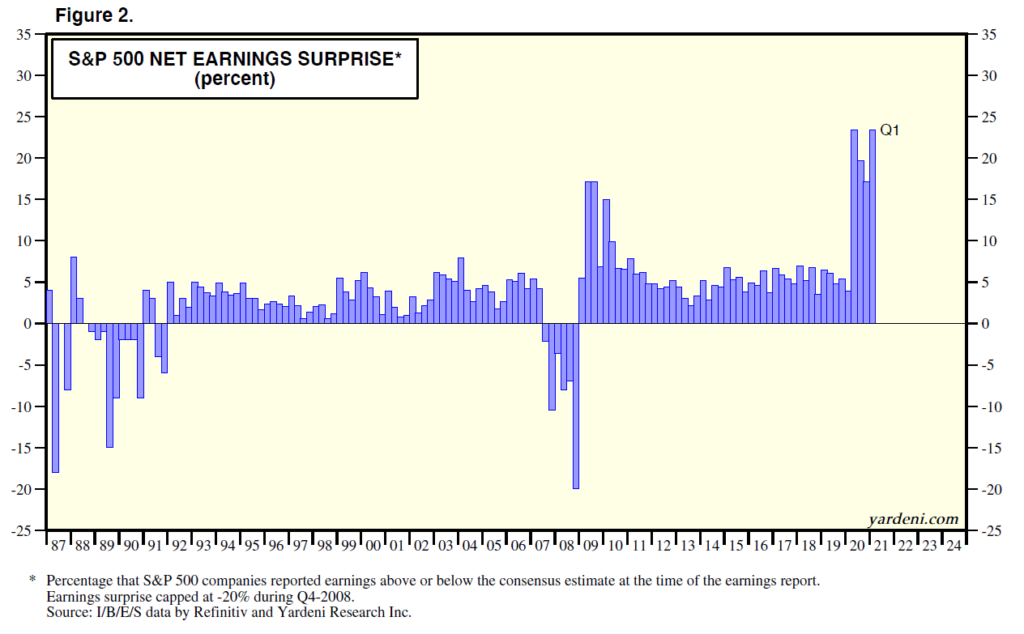
What this means is that consensus earnings estimates have been underestimated and are now being revised significantly higher. One of the reasons this has occurred is that analysts cut their earnings estimates by huge amounts after the pandemic struck the global economy in March of 2020. At that time, stock analysts slashed and burned their earnings estimates given that the world had just entered the deepest recession since the Great Depression. As we all know this recession was very short lived thanks to the vaccine approvals and unprecedented levels of fiscal and monetary stimulus. The speed and the magnitude of the global economy recovery has forced analysts to revise their estimates higher and there could be more to come. What this means is that the stock market may not be as expensive as it looks on the surface.
Positive earnings revisions are always a welcome sign. But it’s especially impressive at this point in time given that the world is still in the very early stages of re-opening the economy. Once that happens, there is a substantial amount of pent-up demand that should provide a key driver for sustained growth in the global economy.
How much pent-up demand are we talking about? We believe there is a huge amount of pent-up demand given that most people were trapped inside their home for the better part of the last year. As most people get vaccinated, they will want to travel, eat at restaurants, go shopping, and go see concerts and live sporting events. One way to think about the level of pent-up demand is to look at excess savings. Moody’s defines excess savings as the additional savings compared with the 2019 spending pattern and equating to more than 6% of global gross domestic product. Based on this definition, households have saved massive amounts of money since the start of the pandemic. This point is illustrated in the chart below.
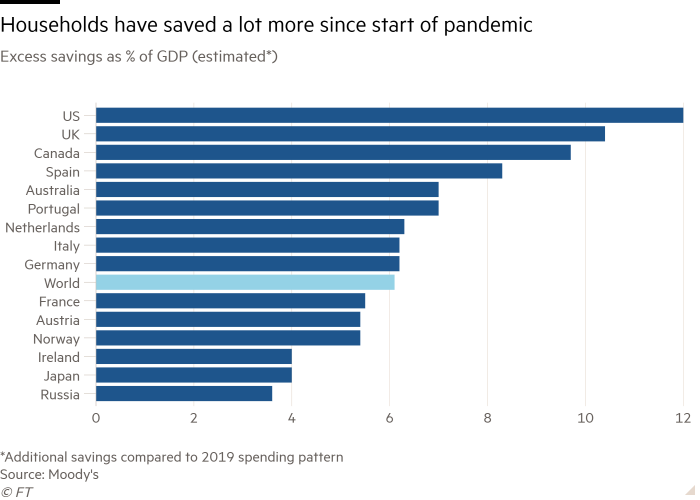
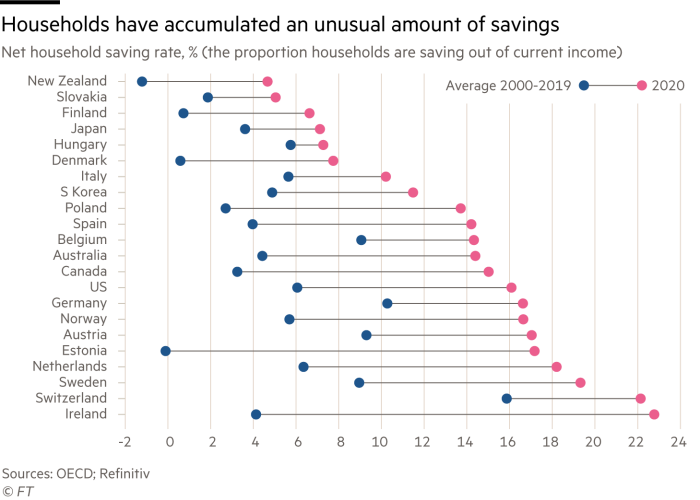
Based on this definition, it has been estimated by Moody’s that consumers around the world have stockpiled an extra $5.4 trillion of savings since the pandemic began. As seen in the chart below, consumers have accumulated a level of savings that is well above the average of the last 20 years.
Furthermore, consumers are becoming increasingly confident about the economic outlook, paving the way for a strong rebound in spending as economies re-open around the world. As seen in the chart below, the Conference Board’s Global Consumer Confidence Index recently reached its highest level in the last 15 years.
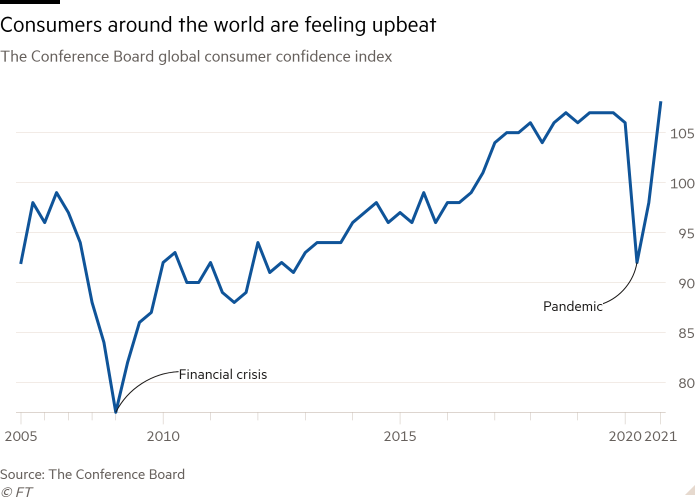
Bringing it all together, it appears that there is both the ability (excess savings) and willingness (consumer confidence) for consumers to unleash this pent-up demand. This is a powerful combination and we believe it will provide a very important driver for the global economy, corporate earnings, and global equity markets.
Have a good weekend,
Phil
Climbing The Wall of Worry
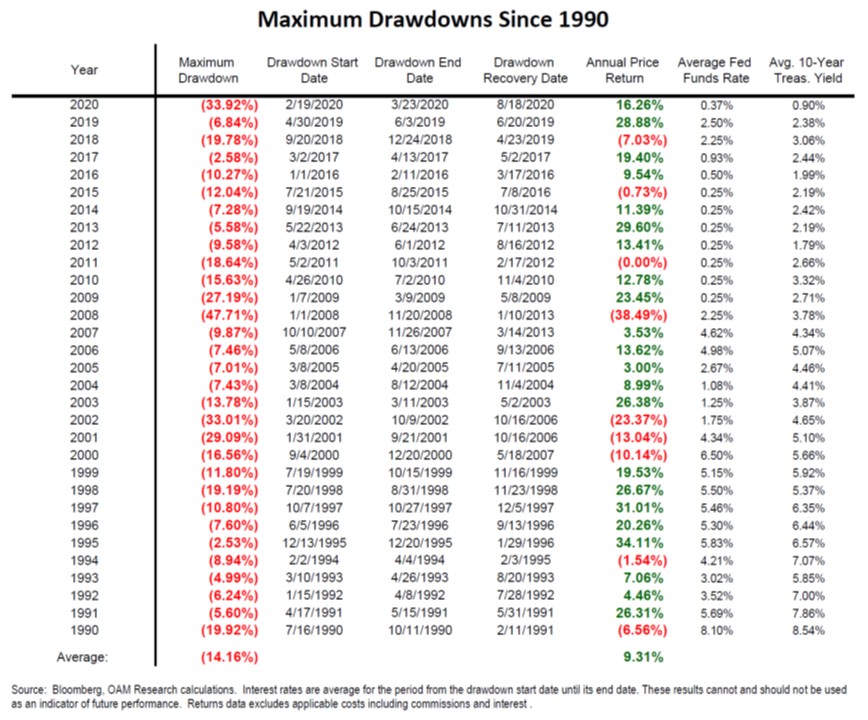
Global equity markets have been volatile over the last week with stocks meandering back and forth between positive and negative territory. After a huge run in the stock market over the last year, it is reasonable to expect a period of consolidation although the timing of this is uncertain. As seen in the chart below, the average annual drawdown from peak to trough was 14.2% over the last 40 years.
Over the last year the stock market has done a very fine job of climbing the so-called wall of worry. Going forward, the market will have to continue to do so because there is always a of list of worries for investors to fret about. At the current moment, the list of concerns includes rising interest rates, a spike in COVID cases, inflationary pressures, and a likely tax hike for U.S. Corporations. In addition, there are numerous signs of speculation including margin debt at all-time highs, investment sentiment readings showing extreme levels of optimism, and companies with no earnings finding their way into the public markets using SPAC’s (Special Purpose Acquisition Corporations). What should a rational investor do in the current environment? We will revisit this question in a moment. But first, let us consider what the experts are focused on.
In recent months, it appears that market strategists and economists are spending an increasing amount of time trying to make predictions about the U.S. 10-year Treasury Yield, the US dollar, the level of economic growth, and the forthcoming inflation. These predictions are then used to determine ‘the best trades’ for investors such as the decision to be invested in value or growth stocks. We don’t try to make predictions about the 10-year Treasury Yield or the inflation rate, nor do we spend much time thinking about the narrative on growth versus value stocks. We don’t believe it is easy to execute a strategy based on forecasting the twists & turns of the global economy and then re-adjusting the portfolios accordingly. When it comes to the debate on growth versus value, we don’t spend a lot of time thinking about it. One of the key issues with the ongoing debate about growth and value is that the term ‘value’ means different things to different people. This has created confusion over the years. In his 1992 letter to shareholders, Warren Buffet shared some interesting perspectives on the growth versus value debate.
“Most analysts feel they must choose between two approaches customarily thought to be in opposition: “value” and “growth.” Indeed, many investment professionals see any mixing of the two terms as a form of intellectual cross-dressing. We view that as fuzzy thinking (in which, it must be confessed, I myself engaged some years ago). In our opinion, the two approaches are joined at the hip: Growth is always a component in the calculation of value, constituting a variable whose importance can range from negligible to enormous and whose impact can be negative as well as positive. In addition, we think the very term “value investing” is redundant. What is “investing” if it is not the act of seeking value at least sufficient to justify the amount paid? Consciously paying more for a stock than its calculated value – in the hope that it can soon be sold for a still-higher price – should be labeled speculation.”
So, what should a stock market investor do in the current environment? We don’t believe there is a ‘right’ answer but this is what we are doing. We follow a consistent investment philosophy that has been in place for many years. In a nutshell, we build concentrated portfolios with high quality companies and we use a long-term investment horizon. We are looking for companies that are run by experienced management teams with a history of prudent capital allocation. We invest in corporations that have a competitive advantage or a protective moat around their business. By doing this, we end up with a portfolio full of companies that operate in industries with high barriers to entry. This makes it difficult for new competitors to enter the market and typically allows our companies to earn above average returns on invested capital for extended periods of time. These types of companies typically generate robust free cash flow and can do so across the business cycle. High quality companies tend to hold up well during periods of market weakness given the stability of their earnings. Our portfolios held up well during the market panic of 2020 and we believe they will do so again when the stock market goes through the next phase of market weakness.
Have a good weekend,
Phil
