A Challenging Market Environment
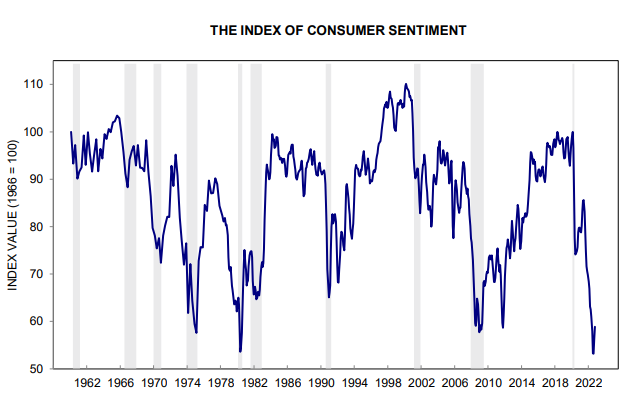
Well, it seems like bad news all around as the U.S. Federal Reserve continues its fight against inflation. The 10-Year U.S. Treasury yield has recently climbed above 4%, a level that is significantly higher than anything we have seen in recent years. The economy is slowing and consumer sentiment measures are at depressed levels. Consumer sentiment indexes are leading economic indicators that measure changes in the outlook for the economy. They are based on how shoppers feel about their interest and willingness to buy things in the future. As seen in the chart below, the University of Michigan Consumer Sentiment index is near 50-year lows.
In the first half of the year, corporate earnings had held up well, but in recent weeks the cracks have started to emerge. In the most recent earnings season, management teams have become increasingly cautious and guidance has fallen short of expectations. And this is happening to large blue-chip companies across various sectors including Technology, Industrials, Consumer, and Healthcare.
When it comes to company guidance, disappointment is a problem because the attention span for investors has become shorter and shorter in recent years. Investors tend to obsess over near-term prospects whether it’s the next economic data point or the next quarter for a company. A focus on the short term leads to active trading and volatility in stock and bond markets. And that’s exactly what we are seeing today.
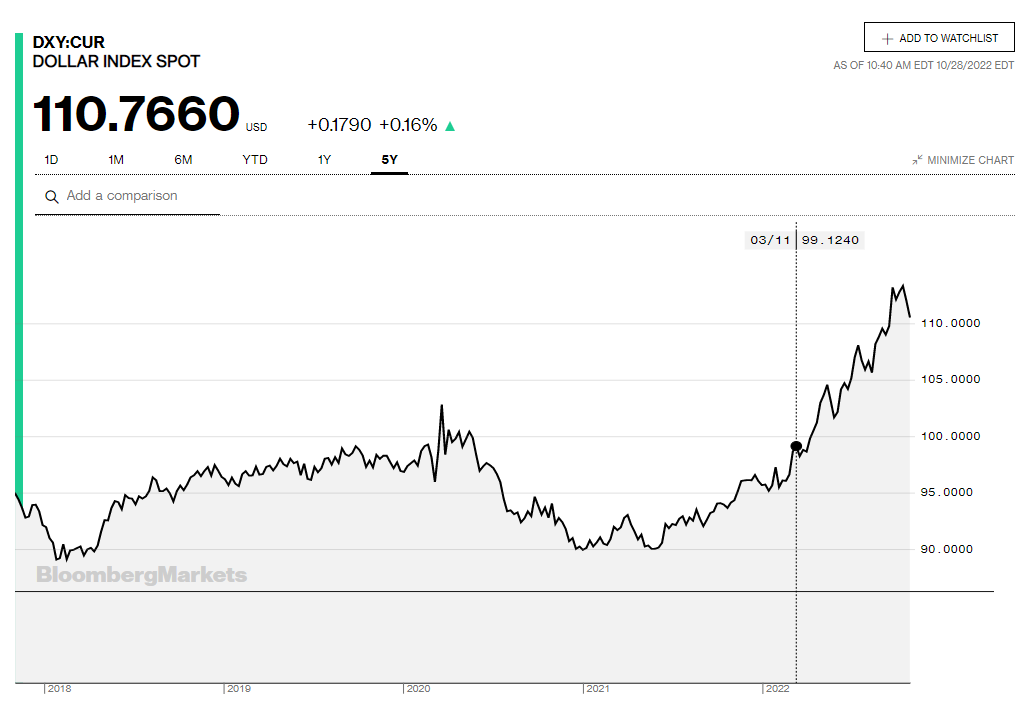
Inflation remains uncomfortably high and the Fed won’t stand for it so U.S. Federal Reserve Chairman Jay Powell continues to increase interest rates. The result of this is that it will continue to slow the economy. One of the unintended consequences of the rapid rise in interest rates has been the big move in the value of the U.S. dollar as seen in the chart below which shows the jump in the DXY. The DXY is also known as the U.S. Dollar Index, which is an index of the value of the US dollar relative to a basket of foreign currencies.
Significant U.S. dollar strength has negative implications for domestic U.S. companies because their exports are more expensive and therefore less attractive to foreign buyers. It’s also challenging for US-based companies which have large footprints outside of the United States as profits earned abroad in other currencies translate back to fewer dollars and therefore lower reported earnings. This has been a key factor in the recent guidance downgrades.
A strong U.S. dollar also has negative implications for countries around the world who have high levels of debt that are denominated in U.S. dollars. Furthermore, commodities are priced in U.S. dollars so the cost of consuming commodities such as energy and agriculture for countries outside of the U.S. has gone up significantly. It’s no wonder that inflation has been stubbornly high.
So, the headwinds for stocks are real……but…the value of a stock is always calculated by taking the present value of the future cash flows generated by the company. A temporary slowdown in the economy and lower earnings for a few quarters does not impair the business value of a strong company. We own several world-class leading businesses that have seen their share price decline by 30% or more. I am fairly confident that the business value for these great companies has not been impaired by 30%. In fact, many of the great businesses we own are taking actions that will increase the future value of their business.
As this bear market plays out, our companies are investing in their businesses, they are generating substantial free cash flow, and they are taking market share from weakened competitors. Some will make acquisitions and buy assets on the cheap from distressed competitors that need the money now. We are highly confident that our companies will come out on the other side even stronger when the current bear market reaches its conclusion. When we get to that point we think it’s highly likely that our companies will be more valuable, not less valuable, as today’s share prices may lead some investors to believe.
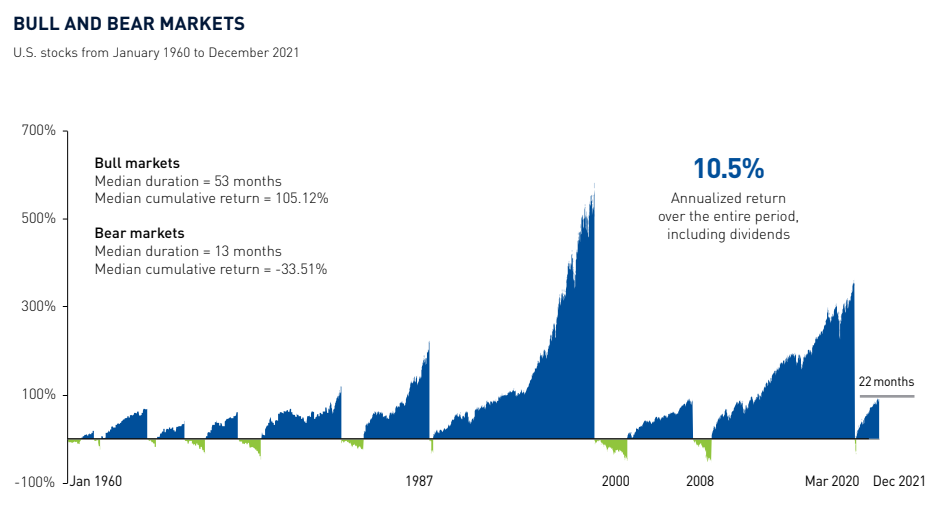
As we all know, market drawdowns are very painful while we are in the moment. But over the long history of the stock market, bear markets eventually run their course and new bull markets begin. And the gains that are generated during bull markets are significantly higher than the losses made during the bear markets as seen in the chart below.
During this period of market dislocation, we are actively searching for the babies that are being thrown out with the bath water, so to speak. Opportunities are being created and we are going to take advantage of them as they come our way.
Have a good weekend,
Phil
Third Quarter 2022 Global Equity and International Review
Market volatility remained elevated during the third quarter of 2022. After experiencing the largest first half decline since 1970, the S&P 500 started Q3 on a strong note by climbing nearly 14% during the first six weeks of the quarter. This rally created a lot of optimism for investors with market experts starting to believe that a soft landing in the economy had been achieved.
However, this optimism proved to be short lived as the S&P 500 fell by nearly 17% during the last six weeks of the quarter. The challenging market conditions during the third quarter were global in nature as equity markets throughout Europe and Asia experienced significant bouts of volatility just like the S&P 500. Market volatility during Q3 was driven by the same factors that
led to market weakness in the first half of the year. These factors include persistent inflation, tightening by central banks around the world, and the war in Ukraine.
Is This a Bear Market Rally?
Is this a bear market rally? A good case can be made that it is and an equally good case can be made that it’s not a bear market rally. What do we think? We do not have strong opinions either way. Trying to figure this one out is like trying to predict if we are going into a recession. It’s very difficult to do and we’ll only know for sure with the benefit of hindsight. Therefore, we are not trying to guess whether it is a bear market rally. Instead, we continue to own a collection of fine businesses that can thrive in an economic recovery but can also hold their own should we be headed for an economic downturn.
Let’s put the bear market rally debate aside for a moment and discuss the strong market performance of the last 2 months. Since reaching a bottom on June 16th, several equity market indices around the world have rebounded anywhere from 10-20%. Despite this powerful market rally over the last 2 months, year-to-date equity returns remain in negative territory with many global equity markets down double digits for the year-to-date period. The reasons are well known. It’s been a perfect storm with record inflation that has caused central banks to raise rates faster than expected, a conflict between Ukraine and Russia, and new outbreaks of Covid-19 that have led to lockdowns in China.
While we are never happy to see our returns in negative territory, we believe investors should keep in mind a famous quote from a legendary investor. “In the short term the stock market behaves like a voting machine, but in the long term it acts as a weighing machine”. The phrase was coined by a British economist named Benjamin Graham. He is considered the father of value investing and was a key mentor for Warren Buffett. What Graham was trying to say with this famous quote is that in the short run, the market votes on which firms are popular and sends stock prices up and down accordingly. But in the long run, the market will assess the underlying fundamentals of a company to give its true weight, or value. On this note, we believe that the underlying fundamentals for our holdings remain highly attractive.
Thus far in 2022 it’s been the energy stocks that have been popular while quality stocks have been very unpopular. We own quality companies and it’s one of the reasons why the share prices for many of our companies have been weak. However, we believe it’s important to separate share prices from fundamentals. During a period of time when the global economy was slowing and facing severe disruptions, during a time of war and soaring inflation, with Europe on the brink of a recession and the United States posting two consecutive quarters of negative GDP growth…the majority of our companies delivered stellar results. Here are the results that some of our larger holdings in our global portfolio delivered during their most recent reporting periods:
• LVMH generated revenue growth of 28% or organic sales growth of 19% in Q2 2022
• Diageo delivered 28% sales growth in the first half of calendar year 2022
• First Republic had revenue growth of 22.6% in Q2 2022
• Visa had sales growth of 19% in the April-June quarter of 2022 (their fiscal Q3 of 2022)
• Costco had sales growth of 15% in the April-June period of 2022
• Microsoft has revenue growth of 12% in the April-June quarter of 2022 (their fiscal Q4 of 2022)
• Google had sales growth of 13% in Q2 2022
• UnitedHealth Group delivered 13% revenue growth in Q2 2022
• Thermo Fisher had organic growth of 3% in Q2 2022
• S&P Global was a notable laggard with an organic sales decline of 5% during Q2 2022
Most of the above cited figures would be considered very strong results in a booming economy but to deliver these types of results in a slowing economy that is dealing with significant dislocations is truly remarkable. We continue to have high levels of conviction in the companies we own and believe that they are well positioned to compound in value in the years ahead despite what may transpire in the economy in the near term.
Have a good weekend,
Phil
Is Quality Making a Comeback?
Global equity markets have rebounded over the last several weeks. The leading indices in the U.S. are up more than 10% and several indices across Europe are up nearly 10% from the July lows. Earnings season is now in full swing and although the results have been somewhat mixed, it’s been pretty good with approximately 70% of companies having reported earnings that were above consensus expectations. As we think about the second half of this year, we expect volatility to continue given persistent inflation which has raised the probability of a recession.
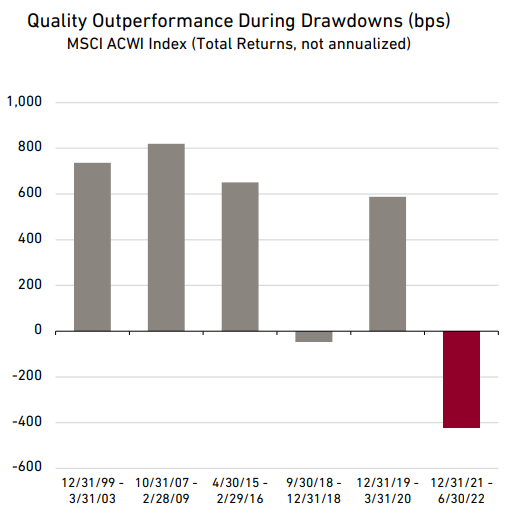
One of the surprising trends thus far this year has been the significant underperformance of the Quality factor. As seen in the chart below, Quality has significantly outperformed during stock market drawdowns over the last 2 decades. In 4 of the last 5 drawdowns, the Quality factor has outperformed the MSCI All Country World Index by approximately 600 basis points or more. However, this was not the case during the first half of 2022. In fact, the Quality factor underperformed the MSCI All Country World Index by more than 400 basis points during the first half of 2022.
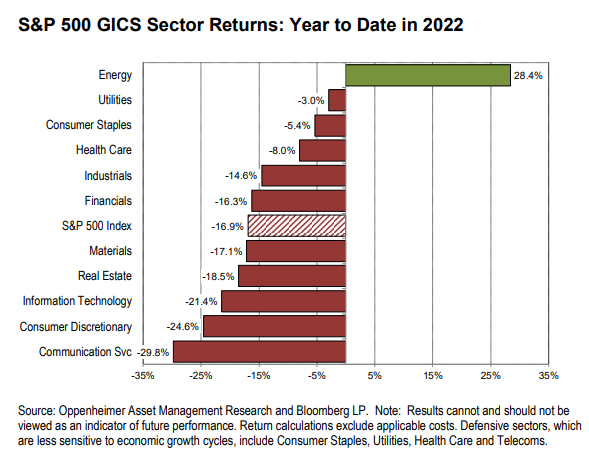
One of the reasons for the underperformance of the Quality factor is that there was a significant reset for valuations during the first half of 2022. Given their attractive characteristics (high ROE’s and stable cash flow generation), quality companies trade at higher valuations. When the 10-year U.S. Treasury Yield more than doubled from 1.5% at year-end of 2021 to nearly 3.5% during the first half of 2022, it caused a significant reset in stock market valuations. Given that high quality companies trade at higher market valuations, they were the hardest hit by this reset in valuations as investors started using higher discount rates to value companies. In addition to this valuation reset, another reason for the significant underperformance of the Quality factor has been the dominance of the Energy sector. This sector has been the best performing sector in the S&P 500 on a year-to-date basis. As seen in the chart below, Energy is not only the best performing sector, but it was the only sector that was up among the 11 sectors in the S&P 500 as of July 25th, 2022.
The Quality factor has started to improve significantly in recent weeks and that is good news for us given that our portfolios that follow our global and international strategies are largely constructed with high quality companies. We invest in quality businesses because we believe that they are more likely to create the most value for shareholders over the long term and they have typically been more resilient during periods of market adversity. Although we are disappointed that quality companies have not been as resilient in the first half of 2022, we are very encouraged to see that they have been performing much better in recent weeks. Importantly, we expect this trend to continue as we believe that investors will gravitate towards high quality businesses as they seek shelter in companies with stable free cash flow generation.
While we are very encouraged by the recent stock market rally, our portfolios continue to have a defensive tilt with significant exposure to stable sectors such as Consumer Staples and Healthcare. Given the ongoing tail risks associated with inflation and the war in Ukraine, we believe it is prudent to maintain a somewhat defensive posture. We also believe that our exposure to high quality companies will serve us well given the current market backdrop and that we own the types of companies that can weather the volatility that may lie ahead.
Have a great long weekend.
Phil
Investing for the Long Term
Year to date, stock price performance has felt extremely painful given that so much damage has been packed into a 5-month period. There’s a lot for investors to worry about these days including the highest level of inflation in 40 years, an aggressive US central bank that’s trying to tame inflation by hiking interest rates, and Russia’s invasion of Ukraine.
Taken together, these factors have created a lot of chaos in the market. The weakness is especially pronounced in the Technology sector but has also been evident in other sectors such as Consumer Discretionary, Healthcare, and Industrials. To illustrate the carnage out there, Ecommerce stocks (as measured by the ProShares Online Retail ETF) were down more than 60% from last year’s peak. Fintech stocks (as measured by the Global X FinTech ETF) fell more than 50% from last year’s peak. Looking at the NASDAQ, more than half of the companies in the index were down more than 50% from their prior peaks.
We have felt the pain in our portfolios with share prices for our companies down significantly thus far in 2022. Our global and international portfolios declined by more than 20% at the height of the recent selloff. While it’s always disappointing to see our portfolios decline in value, it seems less painful when viewed in the context of the huge gains that were made since the COVID lows in March of 2020. After all, several stock market indices in the US and around the world more than doubled in value in less than a 2-year period.
What’s more important than short term gyrations in stock prices is the long-term fundamentals for the businesses we own. On this front, we are very encouraged as we believe that the long-term fundamentals for our companies remain very attractive.
At times like this, I like to remind myself that historically the market rises about two-thirds of the time. But one-third of the time the markets go down, and sometimes the markets go down a lot. In fact, over the last 15 years the S&P 500 has fallen by approximately 20% or more on 5 different occasions. During the Financial Crisis in 2008-09, the S&P 500 experienced a peak to trough decline of more than 50%. In 2011, the S&P 500 had a drawdown of 20% during a period when the rating agencies downgraded the credit rating of the United States. Toward the end of 2018, the S&P 500 fell by approximately 20% and in early 2020 the S&P 500 fell by more than 30%. And here we go again with the latest market sell-off reaching a 20% decline albeit on an intra-day basis. Living through these periods of market turbulence is one of the most difficult parts of investing. But, if one wants to reap the rewards of long-term investing, there is no practical way to avoid these occasional stock market dislocations. The best way to compound wealth over the long-term is to invest in winning businesses and own them for the long run. Staying the course has been critical to realizing the powerful compound returns of the best companies. And investors must do this knowing that from time to time, they will experience large drawdowns.
In July 2020, Hendrick Bessembinder, a finance professor at Arizona State University, published a series of papers with an important and surprising conclusion. Even the stocks of companies that have created the most wealth for shareholders experience deep and protracted share price reversals along the way. Apple, Amazon, and Berkshire Hathaway are good examples of remarkable companies with exceptional long-term stock performance that have gone through huge drawdowns.
Of all the companies in the study, Apple created the most wealth in the decade from 2010-2019 adding $1.5 trillion of shareholder value. However, there were large retracements along the way. For example, Apple’s share price fell by 40% over 9 months in 2012. Looking back further, Apple shareholders have earned a compound annual average return of 20% since Apple’s IPO in 1980, but they have experienced drawdowns of more than 70% on three separate occasions.
Amazon is another success story and was the fourth-best performer in the Bessembinder study, with shareholder wealth growing by more than $600 billion between 2010 and 2019. But like Apple, Amazon’s stock has not been immune to large drawdowns. Although Amazon shareholders made compound annual average gains of 36% from the 1997 IPO, they also suffered through the dot-com crash of the early 2000’s when Amazon’s share price fell by a whopping 91%.
Large drawdowns also happen outside of the Technology sector. Warren Buffett’s company, Berkshire Hathaway, provides yet another example of this drawdown phenomenon. Even The Oracle of Omaha has also been unable to escape significant drawdowns. From 1980 to 2016 Berkshire Hathaway’s stock price appreciated at an average annual rate of 20%, far outpacing the 10% achieved by the S&P 500 index. Despite the massive outperformance, Berkshire’s stock pulled back by at least 30% on 4 separate occasions during that 36-year period. In one instance, Berkshire’s losses were shocking relative to what the stock market was doing. During the dot-com boom in the late 1990’s, Berkshire’s stock price fell by 44% at the same time as the stock market advanced by 23%, representing 67% underperformance. This led to a plethora of articles that suggested Warren Buffet had completely lost his way. As we all know, this was simply not true.
Market selloffs and drawdowns are difficult. But if investors take a longer term view, as we do at Cumberland, market drawdowns should be viewed as the price you pay in order to receive the wealth-building, compounded returns from exceptional companies. We own a collection of outstanding businesses in our portfolios, and we believe that the long-term fundamentals for these companies remain highly attractive.
Phil D’Iorio
First Quarter 2022 Global Equity and International Review
The surge in volatility at the beginning of 2022 was caused by several factors including persistent inflation which led to a more hawkish tone from the U.S Federal Reserve. The outbreak of the war in the Ukraine was also a contributing factor to market volatility. A spike in COVID cases in certain parts of the world also rattled global markets and led to a new round of lockdowns in certain countries such as China. In addition to these factors, some parts of the U.S. Treasury Yield have recently inverted. The yield curve inversion adds another layer of confusion for investors.
Pandemic to War
While writing this commentary, I learned that Russia initiated an official attack against the Ukraine. After Putin announced a special military operation through a televised address, explosions and gunfire were heard in Kyiv. The assault is being mounted by air, land, and sea, and it represents one of the largest attacks on a European state since World War Two. This is obviously a very sad situation and a difficult one given the hardships we have already suffered from fighting the global pandemic over the last 2 years. In terms of the impact, these types of regional conflicts have not had a significant impact on the global economy. People will continue to travel and businesses will carry on assuming this remains a regional conflict. Remarkably, these types of conflicts tend to have short-lived impacts on the stock market as we’ll discuss later in this piece.
After a very strong year in 2021, global stock markets have started this year on a very weak note. Both the MSCI World Index and the S&P 500 have declined by more than 10% from their highs. While this is disappointing for investors, stock market corrections have been a normal occurrence throughout history. In fact, over the last 30 years, the average annual peak to trough decline for the S&P 500 has been approximately 15%. In addition, it’s very typical for the stock market to eventually go through a period of consolidation after emerging from a recession. Looking back at previous market cycles can provide some context in this regard. In both 2003 and 2009, the S&P 500 generated substantial gains as the economy exited the recession. And this is exactly what happened in the economic recovery following the COVID-induced recession of 2020. The economic recovery has not only been one of the fastest on record, but it has also been one of the strongest recoveries from a stock market perspective. Both the MSCI World Index and the S&P 500 more than doubled in value from their March 2020 lows. And this happened in a span of less than 2 years, which is remarkable when you consider that average annual stock market returns have been in the high-single digit percentage range over the last 100 years.
Throughout history, the stock market has typically generated outsized gains in the aftermath of a recession. This is what happened in the last 2 recessions that occurred in 2001-02 and 2008-09. However, after large snapback rallies, the S&P 500 moved to a choppier phase in 2004 and 2010 as the market consolidated its gains as seen in the charts below.
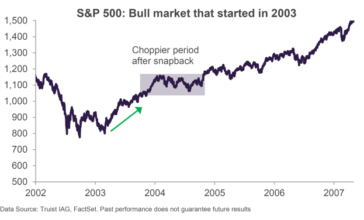
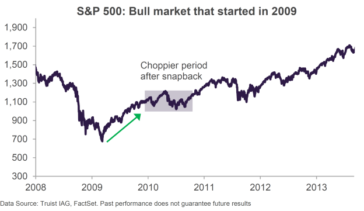
We believe the current market weakness that we have experienced thus far in 2022 is reminiscent of what happened in the last 2 downturns and almost every downturn that preceded those. The good news is that despite the choppiness that ensued in both 2004 and 2010, the bull market in both time periods still had several years remaining.
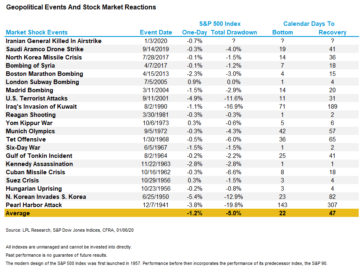
Returning to the situation in the Ukraine, stock markets tend to overreact to geopolitical events. After the Iraqi invasion of Kuwait in 1990, for example, the S&P 500 initially fell by 17% but later regained its previous high within about six months. While any military conflict is always a concern, the reality is that unless this develops into a much larger conflict, it is unlikely to be a long-term issue for the stock market. As seen in the chart below, geopolitical conflicts tend to have short-lived impacts on the stock market.
In terms of our actions, we are diligently looking for opportunities in the current market selloff and we believe it will prove to be a good buying opportunity for long-term focused investors such as ourselves. The level of bearishness in the stock market has increased significantly as per the surveys from the American Association of Individual Investors. This sentiment survey measures the percentage of individual investors who are bullish, bearish, and neutral on the stock market in the short term. As seen in the chart below, the current level of bearishness now (19.3% bullish) rivals the levels reached during the Great Financial Crisis (2008) and the height of the COVID Pandemic (2020). Both of these periods proved to be good buying opportunities.
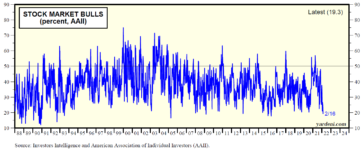
From a contrarian perspective, we view this development as a bullish signal. When the AAII Bull/Bear Ratio has reached these depressed levels in the past, it has historically created an attractive buying opportunity. This doesn’t mean that the stock market can’t fall further in the near-term, but it does send a strong signal to us that we should be hunting for bargains.
Looking forward, we believe that stock market gains will moderate from the robust levels of the last 2 years and we expect there will be more volatility in the near term. Given the current level of uncertainty, forthcoming interest rate hikes, and the fact that we are moving later in the economic cycle, we believe that quality will become increasingly important. Companies with strong balance sheets that can generate substantial free cash flow throughout the economic cycle should be rewarded in the current environment, even if their stock prices have retraced some of last year’s strong gains in the year to date period. Investing in high quality companies is right in our wheelhouse so we are confident that our portfolios are well positioned for today’s stock market environment and as it evolves with the passage of time.
In summary and with the above said, the current environment is complex and there is much more to say. As such, we invite you to join a live meeting on Monday, February 28 at 4.30PM EST to hear more from our investment team about how we see the current situation unfolding, our portfolio positioning, and our current views on the market. We will also open the session to your questions at the end.
Have a great weekend,
Phil
Fourth Quarter 2021 Global Equity and International Strategies
2021 was an interesting year for investors to say the least. Stocks surged on the back of a global vaccine rollout, investors embraced cryptocurrency as Bitcoin soared to new heights, and the Metaverse became a mainstream concept with Facebook changing its name to Meta Platforms in a symbolic move.
Let’s Talk About Inflation
In our recent conversations, a frequent topic of discussion has been around inflation. For the last few quarters, companies around the world have experienced rising input costs and tightness across skilled labour markets. Businesses are reporting difficulty with transportation and this has been exacerbated by the rising cost of shipping containers. Power outages, a shortage of truck drivers, and a large spike in the price of oil have also contributed to the current environment in which we find ourselves.
Are investors’ concerns surrounding inflation justified? We would say yes. As seen in this chart, U.S. consumer prices jumped in October at the fastest pace in three decades as inflationary pressures spread further throughout the economy.
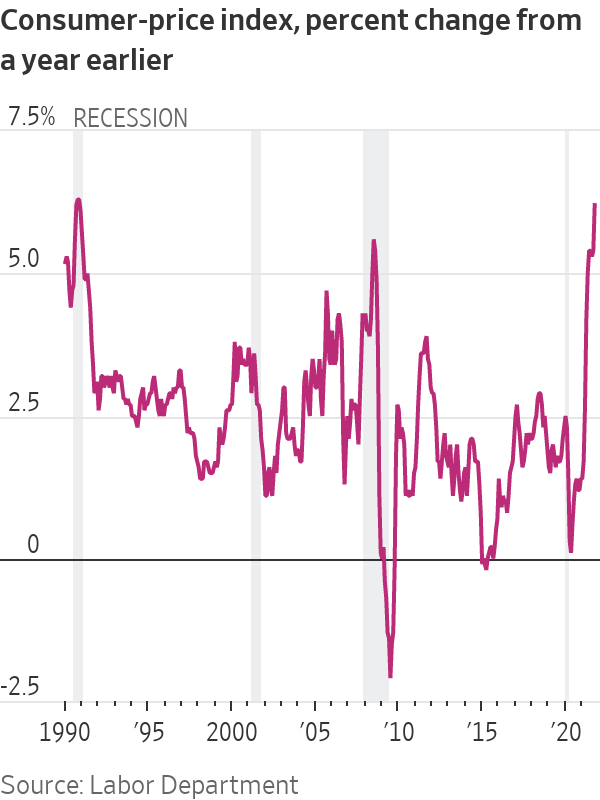
The U.S. consumer price index (CPI) rose to 6.2% during the month of October. This represents the highest level since 1990 and it also marks a sharp increase from September’s level of 5.4%. While almost every single subindex was higher, the key drivers behind the rapid increase were energy, shelter, food, and new & used vehicles.
Policy makers prefer to focus on the core consumer price index which excludes the impact of food and energy costs, both of which can be highly volatile. However, even if we use the core CPI index, it tells us that U.S. inflation rate hasn’t been this high in 30 years. The recent core consumer price index measure was 4.6%, which is the highest level since 1991.
The inflation measures in Canada are somewhat lower but still concerning. As seen in the chart below, Canada’s consumer price index increased to 4.7% during the month of October.
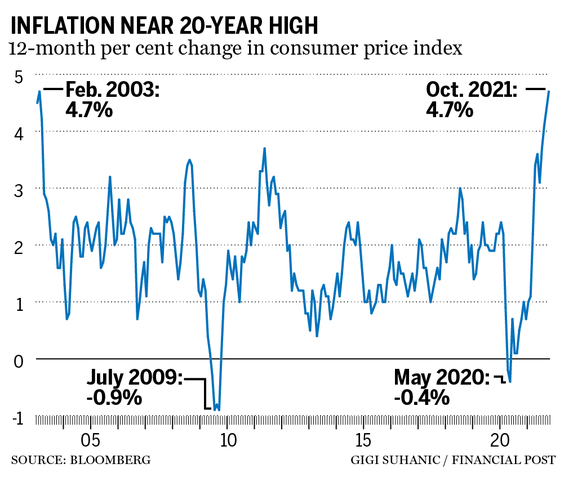
Inflation is nearing its fastest pace since the Bank of Canada began using the consumer price index to set interest rates in the early 1990’s. The last time Canada’s consumer price index reached 4.7% was in February of 2003.
Economists and policy makers hope that inflation will be transitory, but the longer inflation lingers, the more likely it is that central banks will have to start raising interest rates and likely sooner rather than later. And perhaps at a faster rate than the market currently expects.
The question of whether inflation is transitory is important given that stocks have performed very well in the low interest rate environment that has existed for the last decade plus. Investors have coined the acronym TINA (There is No Alternative) to describe this phenomenon of investors paying higher prices for stocks than they have historically with low interest rates as the primary justification. However, if the stubborn bout of inflation persists, it will force central banks to raise interest rates. If this happens sooner and at a faster rate than the market is expecting, then investors may start to believe that TINA isn’t true anymore and they may gravitate towards bonds, which have less volatility. If this happens, it will spell trouble for stocks.
At the end of the day, the key question for investors is whether the current wave of inflation is transitory in nature or whether it will be longer lasting. Figuring out the answer to this question is very complicated given that there are so many different factors involved. To get to the bottom of this hotly debated issue, we need to answer a series of questions. Is the housing market strength sustainable, and if so, how long will it take for supply to catch up to this new level of demand? When will the COVID-enhanced unemployment benefits expire, turning today’s labor shortage into a labor glut? Will productivity surge in the aftermath of the pandemic due to new efficiency gains, thereby reinforcing the persistent and decades-long disinflationary pressures that have existed around the world? Will tensions between China and the United States result in a long-term move away from globalization, which has kept inflation under control for decades? Will the ruptured global supply chains be repaired in the next 6-12 months? Will high oil prices lead to demand destruction and ultimately cause a crash in oil prices just as energy producers decided it was a good time to increase their oil production?
These are very difficult questions and there are too many unknown factors making it very difficult to model future inflation with any degree of accuracy. So, if we can’t predict the rate of inflation into the future what should we do? The approach we have taken is to prepare for a wide range of scenarios. We believe that our portfolios have been constructed in a way that can hold up well in different types of economic backdrops including both inflationary and disinflationary environments. We believe the best way to accomplish this objective is to invest in high quality companies or what we like to call quality compounders. High quality companies have strong market positions, sustained pricing power, and seasoned management teams that can adapt to changes in the economic environment. In a higher inflationary environment, we believe that our companies will be well positioned due to their strong pricing power which will allow them to raise prices at least as fast as their costs and probably even faster. High quality businesses tend to have strong value propositions that enable them to pass on higher inflation to their customers. The ability to pass on higher inflation means that our companies can maintain or increase their expected future free cash flows in real, inflation-adjusted terms. In a disinflationary environment, we believe our companies’ pricing power will enable them to prevent their prices from falling as fast as their costs. We also believe that the dominant market positions and conservative balance sheets of our companies would allow them to survive and take market share from distressed competitors in a tougher economic backdrop.
In summary, we do not have strong views on the future level of inflation given the complexities involved in predicting the future rate of inflation. At a very high level, we believe that inflation will remain elevated in the short term. However, we also believe that many of the inflationary problems affecting the economy will get resolved over the medium term. When it comes to managing our portfolios, our positioning is not determined by a view on whether inflation will be transitory or not. Instead, we prefer to construct our portfolios with high quality companies that can perform well across a wide range of different economic environments.
Have a good weekend,
Phil
A Case for Optimism
After a brief period of volatility in September, global stock markets have resumed their upward trajectory during the month of October. In recent days several stock market indices have set new all-time highs including the MSCI World, the S&P 500, and the Nasdaq Composite Index. This should be viewed as a bullish sign, but it certainly feels like we are still climbing a Wall of Worry rather than celebrating new all-time highs. This is understandable given that there is a fairly long list of reasons to worry.
Today’s worries include but are not limited to, elevated stock market valuations, labor shortages, inflationary pressures, concerns around Federal Reserve tapering, the disfunction in Washington and the ongoing issues around the U.S. debt ceiling, China’s regulatory debacle and the evolving saga at Evergrande, the delta variant and whatever variant might emerge next, tightening global monetary policy, a developing energy crisis, and an array of inflation threats from a damaged global supply chain. All of these issues have added another brick in the wall for the bull market to climb over.
When we consider each of the forementioned risks, we view inflation as one of the more serious risks. Economic data has been pointing to stickier than expected levels of inflation tied to supply chain disruptions and labor shortages. If inflation remains persistent for an extended period, it will become a problem because it has been labelled as a transitory phenomenon by Central Banks around the world. If inflation is not transitory and it turns out to be significantly above market expectations, then the U.S. Federal Reserve Bank will ultimately find itself behind the curve. Under this scenario, it would be reasonable to expect a series of interest rate hikes that happen sooner and perhaps more frequently than the market expects. Based on history, this would spell trouble for the stock market.
From our perspective, we believe that inflation will remain elevated in the short term. However, we ultimately believe that most of the world’s supply chain issues will get resolved at some point in 2022. On a longer- term basis, we believe that there are several secular forces in the economy that will keep inflation in check. These forces include advances in technology and aging demographics. In addition to these secular trends, we believe that productivity will also be a key factor that drives down inflation. While the global economy has recovered significantly from the COVID-induced recession of 2020, there is still a significant amount of slack remaining in the economy. We believe that the global economy will grow at a healthy rate over the next few years on the back of pent-up demand from consumers and as global supply chains are repaired. We are especially optimistic about the recovery potential for the Consumer Services sector which includes restaurants, hotels, and travel related industries.
We believe that the United States will be a key driver of the global economic recovery. As we all know, the U.S. economy has important implications for the global economy because of its size and interconnectedness. The U.S. is the world’s single largest economy and it is also the largest recipient of foreign direct investment in the world. The U.S. Consumer is a crucial component of the economy given that consumer spending accounts for approximately 70% of the U.S. economy. We have an optimistic view for U.S. Consumers given our belief that they have both the willingness and the ability to spend in the years ahead.
The willingness exists because of the restrictions that were in place during the pandemic. As we move beyond COVID and the economy re-opens, consumers will return to baseball and hockey games, they will eat out at restaurants, go see their favorite band in concert, and travel to their cherished vacation destination.
It’s a great thing for U.S. consumers to have the willingness to spend but it’s just as important for them to have the ability to do so. When it comes to their ability, U.S. Consumers appears to be in great shape. There are many reasons for this including higher savings in the years following the Global Financial Crisis, today’s low interest rate environment, and the significant savings that were accumulated during the last 18 months as people were restricted to their homes for extended periods of time.
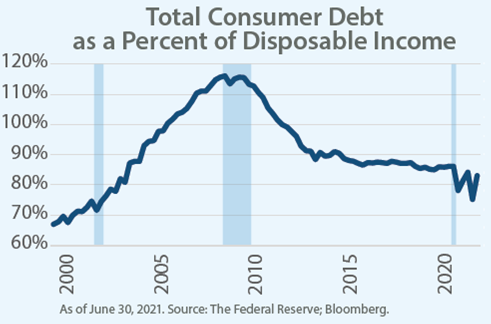
There are several different metrics that are used to measure the health of the U.S. Consumer. Total Consumer Debt as a percent of Disposable Income is a popular metric. Consumer debt is defined as all liabilities of households that require payments of interest or principal to creditors at fixed dates in the future. Disposable income is the amount of money that individuals or households can spend or save after income taxes have been deducted. As seen in the chart below, this ratio is near its lowest level in 20 years.
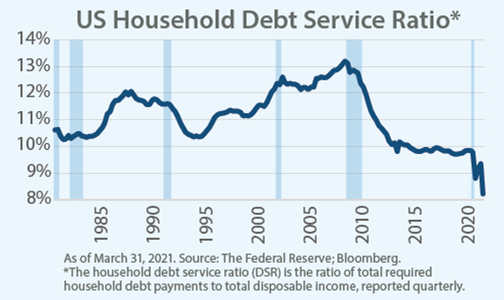
The U.S. Household Debt Service Ratio is another popular measure and it also paints a healthy picture of the U.S. Consumer. This ratio measures the percentage of disposable income that goes to interest on mortgages and other forms of debt. As seen in the chart below, this ratio is at its lowest level in 40 years.
In summary, we continue to have a cautiously optimistic view. We believe there is significant pent-up demand that will help drive growth for the global economy. We are confident that this pent-up demand will be unleashed given the health of the U.S. Consumer and the multiplier effect this will have on the rest of the world. Although inflation will likely remain elevated in the near term, we believe that inflationary pressures will eventually subside. This will occur as global supply chains are repaired, as productivity drives down inflation, and through ongoing help from secular trends such as Technology. Although today’s headlines are often filled with pessimism, we do see reasons for optimism.
Have a good weekend,
Phil
Sources:
Charts: The Federal Reserve and Bloomberg
The Global Role of the U.S. Economy: https://documents1.worldbank.org/curated/en/649771486479478785/pdf/WPS7962.pdf
FOREIGN DIRECT INVESTMENT IN THE UNITED STATES: https://www.selectusa.gov/fdi-in-the-us
