
The Growing Appeal of European Equities
European equities have spent the past decade (2014-2024) in the shadow of U.S. and other developed world stock markets. In fact, European stocks lagged most of the large, developed world equity markets by a very wide margin as seen in the table below.
| Security | Currency | Price Change | Total Return |
| S&P 500 Index | USD | 183.94% | 239.95% |
| S&P ASX 200 | AUD | 52.03% | 160.69% |
| Tokyo Stock Exchange TOPIX | JPY | 97.86% | 148.83% |
| S&P/TSX Composite Index | CAD | 68.17% | 128.44% |
| STOXX Europe 600 Price Index EUR | EUR | 48.04% | 107.07% |
Source: Bloomberg (12/30/2014 – 12/30/2024)
As measured by the broad Stoxx Europe 600 index, European stocks generated less than half of the return of the S&P 500 (a leading U.S. index) from 2014-2024. European equities also lagged Japan, Australia, and Canada, by a significant amount as seen in the table above.
Some of the key factors that have caused Europe’s stock markets to underperform include sluggish economic growth, a lack of innovation, a weak banking sector, and Germany’s debt brake. All of these factors collectively acted as headwinds for Europe’s economy. However, many of these headwinds are now turning into tailwinds, which makes us more enthusiastic about the outlook for European equities in the years ahead.
Before we discuss the positive changes, it is worth revisiting some of the headwinds that led to Europe’s underperformance. The Great Financial Crisis (GFC) in 2008-09 is a good place to begin. While regulators in the United States moved quickly to stabilize their banking sector in the aftermath of the GFC, Europe’s path to recovery was very drawn out and filled with turbulence. In the years following the GFC, Europe went from crisis to crisis with several countries and banks flirting with the prospect of a default. Political upheaval including the Grexit and the Brexit, and other similar events also put stress on the system. To make matters worse, this upheaval was compounded by weak economic growth. This was happening at a time when the European Central Bank held interest rates in negative territory for nearly seven years. This put stress on the banking system by depriving them of their ability to generate sufficient net interest income. This in turn, had a negative impact on their willingness to lend. Taking all of this together, we can call it a negative feedback loop that helps to explain why Europe underperformed other parts of the developed world for the last decade.
But at the beginning of 2025, things started to change. Europe went from a laggard to a leader in terms stock market performance among the large, developed world economies. This can be seen in the table below.
| Security | Currency | Price Change | Total Return |
| STOXX Europe 600 Price Index EUR | EUR | 5.76% | 6.52% |
| S&P/TSX Composite Index | CAD | 1.21% | 2.04% |
| S&P ASX 200 | AUD | -4.76% | -3.35% |
| Tokyo Stock Exchange TOPIX | JPY | -4.53% | -3.37% |
| S&P 500 Index | USD | -5.00% | -4.68% |
Source: Bloomberg (12/30/2024 – 03/31/2025)
While there are many questions about the sustainability of Europe’s performance in the first quarter of 2025, we believe there are positive catalysts on the horizon. Looking forward, the region is set to benefit from lower interest rates, fiscal stimulus, and various initiatives related to investments and competitiveness. Furthermore, Europe’s banking system has returned to a healthy position. This is best exemplified by the fact that European banks have been one of the best performing sub-sectors in Europe over the last 2 years. In fact, from 2022-2024 the European Banks sector outperformed all of the large, developed market indices referenced in this piece. This can be seen in the Appendix.
In terms of monetary policy, the European Central Bank (ECB) cut interest rates by 25 basis points to 2.25% in April. This was the seventh interest rate cut in the current cycle and there are further rate cuts expected. Cutting interest rates should provide a tailwind to economic growth, which would potentially boost stock market returns. Europe’s interest rate cutting cycle stands in contrast to the United States where the interest rate cutting cycle has been on pause since January of this year. Inflation has been more persistent in the United States, so the U.S. Federal Reserve Bank has been reluctant to cut interest rates beyond the initial cuts that began last September.
When it comes to fiscal policy, a significant announcement was made in Germany a few months ago. On March 18, 2025, Germany’s Federal Parliament voted in favour of a landmark bill that plans to unlock hundreds of billions of euros for defence and infrastructure projects. The passing of this bill marks one of the largest fiscal policy shifts in postwar Germany given its decision to relax the debt brake. The debt brake was a constitutional fiscal rule put in place in the aftermath of the Great Financial Crisis (GFC). The debt brake limited government borrowing to 0.35% of GDP, which has acted as a headwind towards capital expenditures since the GFC in 2008-09. As a result of the debt brake, Germany has debt levels far below other countries around the world. Germany’s debt-to-GDP ratio is 62%, which compares with the United States at 124%. Given its low debt level, Germany has considerable room to manoeuvre with fiscal policy. From our perspective, Germany’s new-found commitment to fiscal stimulus should mark the beginning of a renewed cycle of capital and infrastructure investment. This is significant given that Germany is the largest country in the Eurozone. We believe that its spending in the years ahead should have positive flow through impacts to other countries throughout Europe.
In addition to monetary stimulus and Germany’s fiscal stimulus bill, several initiatives have been announced in recent years to boost Europe’s economy. The European Commission recently launched a new Competitiveness Compass, an initiative to improve economic growth in the Eurozone focusing on innovation, decarbonisation, and security. In addition, there is also the Next Generation EU program, which is considered one of the largest economic stimulus packages ever financed in Europe. The size of Next Generation EU is approximately €800 billion, which will be invested across many different areas including digital transformation, healthcare, and the green transition. In addition to the Competitive Compass and the Next Generation EU, there is also the European Chips Act. This Act was designed to increase the region’s position in the globally important semiconductor industry.
On top of all the catalysts outlined above, European stocks also trade at a significant discount relative to the United States based on historical levels as seen in the chart below.
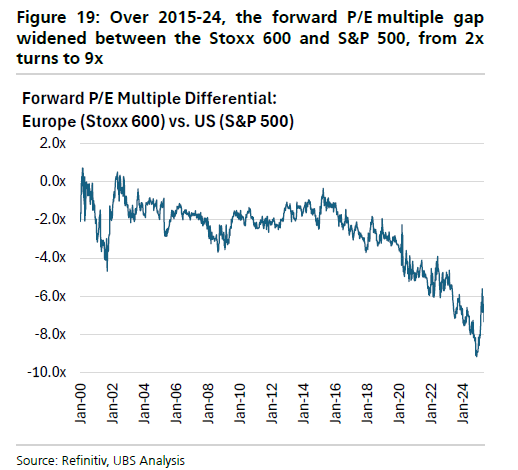
The valuation discrepancy illustrated in the chart above utilizes the price-to-earnings (P/E) ratio. From 2000 to 2016, Europe traded a 2 P/E multiple point discount to the United States. But starting in 2020, the European discount widened significantly and reached a high of 9 P/E multiple points in 2024. Given the rally in Q1 2025 for European stocks, the discount has recently narrowed to about 6 P/E multiple points. However, the discount remains well above the historical average.
In summary, we believe that the outlook for European equities is more promising than it has been in a long time. From our perspective, Europe sits at the centre of a global realignment that has been unfolding over the last few years. This realignment was recently reinforced when the U.S. announced it would withdraw some of its overseas spending on global security. This shift has prompted a significant increase in European government spending, particularly on defence. Looking forward, we believe there are significant catalysts that will provide tailwinds for European stocks in the years ahead. These tailwinds include monetary and fiscal policy, as well as various initiatives that will foster economic growth throughout Europe. We have been positioning our Global and International portfolios to take advantage of the opportunities that lie ahead for Europe.
Appendix
| Security | Currency | Price Change | Total Return |
| iShares STOXX Europe 600 Banks | EUR | 51.01% | 68.02% |
| STOXX Europe 600 Price Index EUR | EUR | 18.82% | 27.16% |
| S&P 500 INDEX | USD | 53.85% | 58.49% |
| Tokyo Stock Exchange TOPIX | JPY | 47.22% | 54.49% |
| S&P / TSX Composite Index | CAD | 27.01% | 35.34% |
| S&P/ ASX 200 | AUD | 17.00% | 29.66% |
Source: Bloomberg (12/30/2022 – 12/30/2024)
First Quarter 2025 Global Equity and International Review
In a reversal of fortunes from previous quarters, the S&P 500 was a laggard among the large developed markets during the first quarter of 2025. Given that the S&P 500 had generated 2 consecutive years of 20%+ returns in 2023 and 2024, it is not surprising that some of the gains from the last 2 years have been given back. The Magnificent Seven (Amazon, Apple, Alphabet, Meta, Microsoft, NVIDIA, and Tesla) were key detractors of performance for the S&P 500 with this group of stocks down more than 15% on a collective basis during the first quarter. The key factor that drove the weakness in the S&P 500 included renewed fears about the possibility of a recession in the US. This fear has been largely driven by the uncertainty surrounding the tariff policy that will be implemented by the Trump administration. Outside of the U.S., positive gains were generated in Japan, Europe, and Canada.
Fourth Quarter 2024 Global Equity and International Review
2024 marked another year of solid returns for global equity markets. The S&P 500 rose 25% on a total return basis, following a 26.3% increase in 2023. The last time this benchmark index generated 2 consecutive years of 20%+ returns was in 1998. The strong returns in the U.S. were driven by a handful of large companies known as the Magnificent Seven (Amazon, Apple, Alphabet, Meta, Microsoft, NVIDIA, and Tesla). On a collective basis, these 7 companies accounted for over half of the return for the S&P 500. Excluding the Magnificent Seven, the remainder of the index returned approximately 10% in 2024. Outside of the U.S., the Tokyo Stock Exchange generated a total return of just over 20%, while the Euro Stoxx 600 index delivered a total return of nearly 10%. The key factors that drove global equity markets higher during 2024 included strong corporate earnings, interest rate cuts from central banks around the world, and significantly reduced fears about a global economic recession.
Q3 2024 Strategy & Market Reviews
Each quarter, our Investment Management teams publish their key observations and portfolio updates across Global Equity and Fixed Income markets. This is a summary of our views for the Third Quarter of 2024. You can download the full reports via the links shown below.
KEY OBSERVATIONS
Yet another good quarter for both the S&P500 and TSX has come to a close, with the S&P 500 up +5.89% in U.S. dollars or +4.59% in Canadian dollars, and the TSX total return up +10.54%.
The much-anticipated monetary policy easing cycle started earlier this month when the Federal Open Market Committee (FOMC) cut interest rates by 50 basis points as Chairman Powell signaled that he was shifting from an inflation hawk to an employment dove. That is, he now cares as much about maintaining employment as he does about reducing inflation.
According to comments from the Fed, we have inflation moving sustainably toward 2%, an unemployment level that, by historical standards, would still be considered low, and a stable real GDP growth outlook of about 2%.
The fact that the Fed has so far successfully engineered bringing inflation down without causing a credit crunch would seem to continue to support the soft-landing outcome that we’ve been a proponent of for some time. Indeed, our own checklist of economic indicators, including the latest GDPNow forecast for Q3, the payrolls data, the current level of credit spreads, and the performance of regional bank stocks, does not suggest any economic stress is present at this time.
In terms of corporate earnings, the S&P500’s third quarter earnings growth of 11.9% bested the estimated earnings growth of 8.9%, according to FactSet Earnings Insight. Forward earnings estimates have been a pretty good proxy for actual trailing estimates, and they are currently hitting all-time highs with an earnings growth outlook for 2025 and 2026 up 15.1% and 12.4% respectively.
Putting this all together, we think a robust earnings outlook, solid economic growth and lower interest rates is a positive backdrop for further share price appreciation. That said, we could see some near-term volatility leading into the U.S. election. However, beyond the election, if history repeats itself, market performance usually improves, and within the framework we just described, we remain constructive on the market outlook from here.
NORTH AMERICAN EQUITY UPDATE
Peter Jackson, HBSc, MBA, CFA
Chief Investment Officer
Portfolio Manager, North American Equities
Our overall equity exposure increased 1% to 97% and cash decreased from 4% to 3%. Our U.S. equity exposure is 55% while our Canadian equity exposure is currently 42%. For portfolios invested in our North American plus International Equity strategy, the US and Canada weights will be proportionately less than this given the current 20% allocation to international companies.
Over the past 12 months, we continued to shift our allocation in favour of US equities (+13%) over Canadian equities (-10%). US earnings growth continues to outpace Canadian earnings growth, and this is estimated to continue in 2025 and 2026. While we are not calling for a recession in Canada, we do believe the risk of one is higher, with economic growth slower and unemployment higher here than in the US. That said, so far, we have been seeing interest rates decline faster here in Canada than in the US, which may mitigate that risk.
We added three new positions during the quarter:
Nvidia Corporation needs no introduction, being the leader in the production of graphics processing units (GPUs) that power Artificial Intelligence (AI). We took advantage of the macro-pullback in the market this summer to initiate a position at a now-reasonable valuation as earnings continue to grow rapidly.
Eli Lilly is a healthcare company that has taken the place of Novo Nordisk in our portfolio, in which we had over a 50% gain. While both Novo and Lilly are strong players in the growing diabetes and obesity market, several factors helped make a compelling case for the switch.
Stantec is a global leader in engineering consultancy with a focus on water and infrastructure. With a strong 5-year compound annual EBITDA growth rate of over 20% and record current backlog, Stantec is positioned to continue to deliver strong operating results.
A detailed review of these companies can be found in the full report per the link above.
GLOBAL EQUITY UPDATE

Phil D’Iorio, MBA, CFA
Portfolio Manager, Global Equities
Global equity markets continued their upward climb this quarter. The S&P was up 20.8% over the first three quarters of the year, the strongest such showing since 1997. Key factors that drove markets higher included strong corporate earnings, interest rate cuts around the world, and reduced fears about a global economic recession.
Japan was an exception, with the Tokyo Stock Price Index falling -5.8%. This was partially driven by concern that recent strength in the Yen will weaken Japan’s exporters. However, we do not believe that this will derail the multi-year uptrend in Japan’s equity markets.
In the latest Bank of America Global Fund Manager Survey, 79% said that an economic soft landing is now the most likely outcome. We share this view for a number of reasons. Among them, strength in the U.S. and global economies, stock market gains that are broadening out beyond the big tech names, and an absence of recessionary signals from the bond market.
We believe conditions look steady across most of the major economic regions with China as the notable exception. During his most recent press conference, Fed Chairman Jerome Powell said that the U.S. economy is growing at a solid pace and that inflation is coming down. In Europe, the economy is growing modestly and is expected to improve significantly in 2025. Meanwhile, China’s economy continues to struggle in the face of sluggish GDP performance, sagging consumer confidence, and a collapse in property prices. The country recently announced a series of stimulus measures to lower borrowing costs, inject funds into the economy, and ease the mortgage repayment burden for households.
The lead-up to U.S. presidential elections has historically been associated with elevated volatility in the stock market. While we were spared from the market weakness that typically occurs in September, we’ll be on guard for potential volatility during October. Furthermore, we will be ready to act and take advantage of any opportunities that are presented to us.
In our Global strategy, we established the follow new positions during the quarter:
Amphenol makes connectors and sensors that are used across a wide range of applications. The company’s products are positioned to benefit from secular growth themes including increasing electrification in automobiles, Artificial Intelligence through data centre growth, and the Internet of Things.
Nvidia Corporation needs no introduction as described above, being the leader in the production of graphics processing units (GPUs) that power Artificial Intelligence (AI). We took advantage of the macro-pullback in the market this summer to initiate a position at a now-reasonable valuation as earnings continue to grow rapidly.
In the International strategy, we initiated three new positions:
3i Group is a private equity company with over 70% of its net asset value accounted for by a company called Action, which is Europe’s fastest-growing non-food discounter. Management is currently considering expanding its store base within and beyond Europe, and we believe there is a long runway of growth ahead for Action.
Disco Corp is the dominant semiconductor dicer and grinder equipment provider with market share of 85% and 65%, respectively. Disco is a beneficiary of more than $10 billion in additional semi-conductor backend processes announced by Taiwan Semiconductor and Intel in Malaysia and New Mexico.
Recruit Holdings is a dominant Human Resources Technology company. Recruit is pursuing a long-term strategy to transform its technology from a pay-per-click model to a pay-per-hire model that could expand its total addressable market tenfold to $327 billion and increase its take rate from less than 1% to a significantly higher level.
A detailed review of each company can be found in the full report per the link above.
FIXED INCOME UPDATE

Owen Morgan, MBA, CFA
Portfolio Manager, Fixed Income
On June 5th, the Bank of Canada cut the overnight interest rate by 25 basis points. This represented the first decline in the overnight rate since the beginning of the hiking cycle in March 2022, and the first cut in the overnight rate since March 2020. In the most recent quarter, the Bank of Canada continued to ease interest rates, cutting 25 basis points again at both its July and September meetings.
The Bank of Canada broadcast these moves ahead of time, and investors largely anticipated them. However, the market continues to believe that rates are heading even lower. The yield curve shifted downwards as a result of these moves over this period. A familiar theme in our recent commentaries is the reminder that when interest rates decline, the prices of fixed income instruments and securities increase. As a result, the third quarter was again a positive period for returns to fixed income investors.
Given the two rate cuts by the Bank of Canada and inflationary data suggesting price pressures are waning, the yield curve moved in a downward trajectory. In addition, the curve flattened quite a bit. However, as the overnight rate remains much higher than both inflation and the two-year interest rate, it seems likely that there may be a few rounds of interest cuts by the Bank of Canada still to come.
We continue to believe the outlook for fixed income is positive for the remainder of the year and likely into early 2025, absent unforeseen shocks. We believe we are in the middle of a rate cut cycle by the Bank of Canada, although the magnitude of the cuts in totality and the length of time the bank will take to complete this phase is still unclear.
In terms of the Cumberland Income Fund investment portfolio positioning, we anticipate further extension in the fund’s duration given our view on near-term interest rate movements. If our outlook is correct, as rates decrease, our securities’ valuation will react positively.
This translates into modest increases or fine-tuning of holdings in the fund’s weights for federal, provincial, and/or investment-grade corporate bonds over the coming quarters. We will maintain exposure to non-investment-grade credits that we identify as having attractive risk-return profiles. Indeed, with corporate spreads remaining relatively steady and below long-term averages, this does not suggest widespread anticipation of recession or of financial stress across the credit spectrum.
Third Quarter 2024 Global Equity and International Review
After delivering attractive returns during the first half of 2024, global equity markets continued their upward climb during the third quarter. For the first 9 months of 2024, the S&P was up 20.8%. This marks the strongest first 9-month performance in any year since 1997. They key factors that drove markets higher during Q3 included strong corporate earnings, interest rate cuts from central banks around the world, and reduced fears about a global economic recession. Stock market returns in the quarter were positive across most of the major developed market regions as
shown in the chart below.
Thoughts on the Market
At the beginning of August, global equity markets experienced a sharp sell-off. In one day, the Nikkei 225 sold off by more than 12% and the S&P 500 fell by more than 3%. There were a number of different factors that led to the sell-off including concerns about slowing economic growth, crowded positioning in Technology stocks, and a rapid unwind of the Yen carry trade. It felt like a perfect storm as all of these factors came to a head at the same time.
Although the market began selling off in late July, it accelerated in early August (on a Friday) on the back of a report from the U.S. Labour Department. The report showed that U.S. Nonfarm payrolls grew by just 114,000 in July. This was significantly below the consensus estimate of 185,000. The same report showed that the unemployment rate edged higher to 4.3%, which marked its highest level since October 2021. This report triggered fears about a recession and led the bond market to price in more interest rate cuts for the U.S. than had been previously forecasted. This shift combined with a recent interest rate hike from Japan’s Central Bank led to the unwind of the Yen carry trade. For many years, global investors have been borrowing money in costless Yen and using the proceeds to buy higher-yielding U.S. bonds as well as U.S. equities including the Magnificent Seven Technology stocks. When the U.S. jobs report was released, it sparked an unwind of the Yen carry trade, which magnified losses in the S&P 500 index and the Nasdaq. It certainly didn’t help that over the weekend Warren Buffet’s company (Berkshire Hathaway) announced that it had cut its position in Apple by nearly half. All of this led to a big sell-off across global markets the Monday following the U.S. jobs report. In a span of less than 3 weeks, the S&P 500 experienced a decline of 8.5%. However, the market drawdown was very short lived. In fact, it took just over 2 weeks for the S&P 500 to rally back to within 1% of its all-time high.
While it’s not easy to precisely explain why the market rebounded so quickly, there are several reasons why we remain cautiously optimistic on global equities. These reasons include recent economic data points that refute the notion of a recession, a broadening out of the stock market, and a clear change in the tone of the U.S. Federal Reserve Chairman.
In terms of economic data, retail sales for July were much stronger than expected and the latest report for U.S. jobless claims showed a decline. In addition, some of the more discretionary areas of the economy remain steady including restaurant bookings, air travel, and hotel occupancy rates. In addition, U.S. gross domestic product increased at a 3.0% annualized rate last quarter according to the Commerce Department’s Bureau of Economic Analysis. This was an upward revision from the 2.8% rate reported last month. Taken together, these data points do not suggest that the U.S. economy is on the verge on a recession.
In addition to positive economic data, there has also been a broadening out in the stock market during the third quarter. After a long period of market dominance, shares of the Magnificent Seven have trailed the shares of the other 493 companies in the S&P 500. This means that the Magnificent Seven are on track to underperform stocks in the rest of the index for the first quarter in nearly two years as illustrated in the chart below.
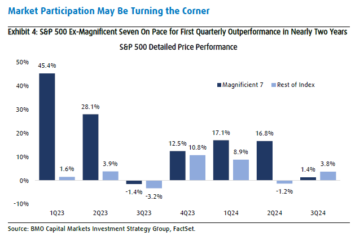
We believe that the broadening out of the stock market is important and that it increases the likelihood of a sustained increase in the stock market going forward.
In addition to positive economic data points and a broadening out of the stock market, there has also been a significant change in the tone from the U.S. Federal Reserve Chairman with regards to interest rates. During the recently held annual retreat in Jackson Hole, Jerome Powell announced that “the time has come for policy to adjust”. He went on to say that “inflation has declined significantly. The labor market is no longer overheated, and conditions are now less tight than those that prevailed before the pandemic”. This is a very significant change in the tone from Mr. Powell and it sets the stage for interest rate cuts with the bond market currently pricing in four rate cuts in the U.S. by the end of 2024.
For all of these reasons we remain cautiously optimistic. But there is one caveat, given that we are entering a period of seasonal weakness as seen in the chart below.
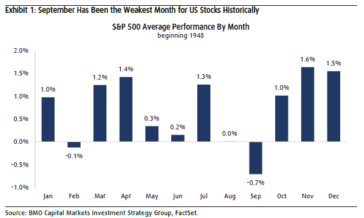
Since 1948, September has been the weakest month of the year in terms of performance for the S&P 500 with an average loss of 0.7%. This is significantly lower than February, which has historically been the second worst month of the year with an average loss of 0.1%. In addition to seasonal weakness, the market will also have to deal with the uncertainty related to the U.S. Presidential Election. Given this backdrop, we may experience elevated volatility in the weeks ahead and we plan to use this volatility to take advantage of opportunities that are presented to us.
Phil D’Iorio
Second Quarter 2024 Global Equity and International Review
After delivering robust returns during the first quarter, global equity markets continued their upward climb during
the second quarter of 2024. Some of the key factors driving the returns included strong corporate earnings, reduced
fears about a global economic recession, and enthusiasm over artificial intelligence that powered massive gains in
Technology stocks. Given this backdrop, stock market returns during Q2 2024 were positive on a total return basis
across major developed market regions.
Debating the Bear Market Narrative
Over the past year, the bear market narrative has transitioned from fears about a recession to renewed concerns about interest rates. The reason why interest rates concerns have re-emerged is due to several inflationary data points that were worse than expected. These hotter than expected inflation reports have shifted investor expectations regarding interest rate cuts from the U.S. Federal Reserve. As a result of this, the bond market is now only pricing in 1 interest rate cut by year-end, which compares with expectations for 7 interest rate cuts at the at the beginning of 2024. Given this shift in sentiment, the U.S. 10-year Treasury yield has jumped from 3.9% at the end of 2023 to 4.5% currently.
Just over a year ago, most investment banks on Wall Street were forecasting a U.S. recession due to the impact of stubborn inflation and high interest rates. In March of 2023, 65% of economists polled by Bloomberg believed that the U.S. economy was headed for a serious downturn within the next 12 months. However, Wall Street has largely abandoned its recession call given the resilience of the U.S. economy over the last 12 months. This shift in sentiment regarding a recession was evident in the Deutsche Bank Global Markets Survey that was conducted in March of 2024. The results from that survey showed that only 17% of respondents expected a recession or a hard landing for the U.S. economy. Although many of the bears have abandoned their call for a U.S. recession, many of them have moved on to a different narrative. The new narrative is that high interest rates are bad for stocks. The argument basically says that the even though the economy will avoid a recession, stocks will perform poorly due to high interest rates. The interesting thing about this new narrative is that history tells us that investors should not fear higher rates. In fact, some of the strongest periods of performance for the S&P 500 over the last few decades have coincided with rising interest rates or higher levels of interest rates.
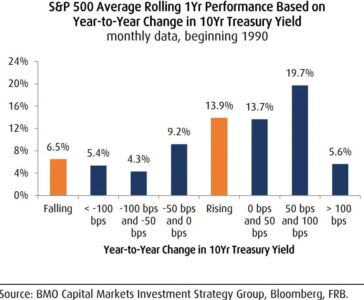
Since 1990, periods of rising interest rates have been associated with stronger stock market returns than periods with falling interest rates. As seen in the chart below, the S&P 500 has posted an average annual price return of 13.9% during periods of rising interest rates, which compares with just a 6.5% average annual gain during periods of falling interest rates.
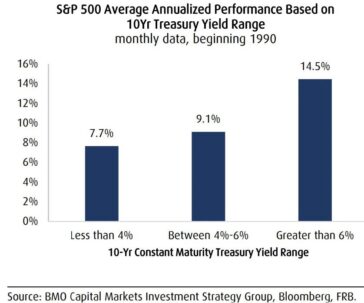
Not only have stocks done better during periods of rising interest rates, but stocks have also generated higher returns during periods when interest rates were at higher levels as seen in the chart below.
Since 1990, the S&P 500 has performed better when interest rates were higher, as measured by the U.S. 10-Year Treasury Yield. When the 10-Year Yield was less than 4%, the average annual return was 7.7%. This compares with an annual return of 9.1% when the 10-Year Yield was between 4-6%, and an annual return of 14.5% when the 10-Year Yield was above 6%.
The data outlined in this note suggests that the current bear market narrative is somewhat flawed. The argument that higher interest rates is bad for stocks is not consistent with the historical data since 1990. This does not mean that there aren’t any risks because there are always going to be risks for the stock market. When we take everything into consideration, we continue to have a cautiously optimistic view for global equity markets. First, the global economy continues to demonstrate resilience which has significantly reduced concerns about an economic recession. Second, while inflation remains above the targeted threshold for many central banks, it is moving in the right direction. This is setting the stage for interest rate cuts in Europe in the months ahead and rate cuts in the U.S. later in 2024 and into 2025 Finally, corporate earnings have been steady and have surprised to the upside across several markets around the world.
First Quarter 2024 Global Equity and International Review
After delivering robust returns in 2023, global equity markets started off 2024 with a bang. Some of the key factors driving the returns included strong corporate earnings, an expectation of interest rate cuts in 2024, and a turn in investor sentiment with investors abandoning their recession calls. Given this backdrop, stock market returns were not only strong, but also widespread across geographic regions.
Should we worry about the narrow breadth and market concentration in the S&P 500?
Over the last several years a lot has been written about the increasing power and concentration of Mega Cap stocks in the S&P 500. Media articles on this subject exploded in 2023 as Technology stocks skyrocketed and a new moniker was born when Bank of America analyst Michael Hartnett coined the term ‘Magnificent Seven’. For the record, the Magnificent Seven includes Alphabet, Amazon, Apple, Meta Platforms, Microsoft, NVIDIA, and Tesla. Apparently this term is a nod to a Western film from the 1960’s, which starred Steve McQueen as depicted in the picture below.

Does this exclusive group of seven stocks deserve all of the attention that it has received? In our opinion, the attention given to the Magnificent Seven is warranted when one considers the magnitude of the returns generated and the significant size that these stocks represent in the S&P 500 index.
As seen in the chart below, the Magnificent Seven generated huge returns in 2023 including 3 stocks that increased in value by over 100%.
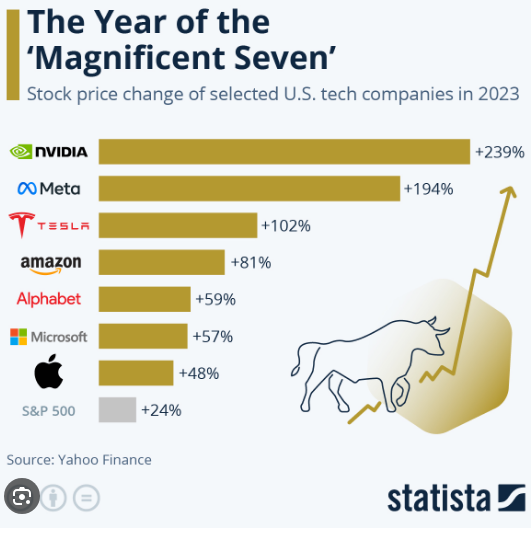
In terms of its contribution, the Magnificent Seven accounted for 62.2% of the S&P 500’s total return of 26.3% (in U.S. dollars) during 2023. Excluding the Magnificent Seven, the total return for the S&P 500 would have been significantly lower with the remaining companies in the index collectively generating a total return of 9.9% in U.S. dollars.
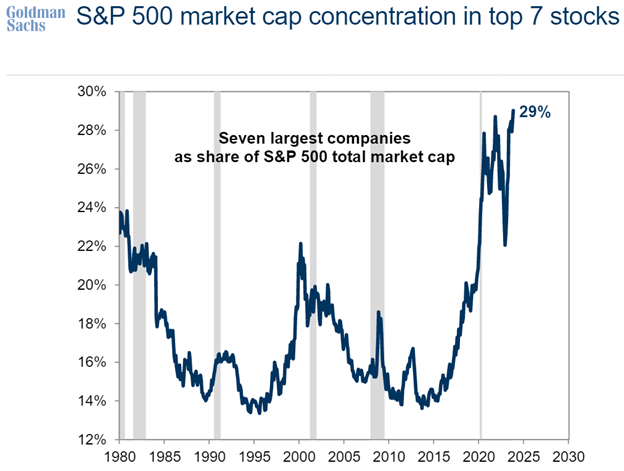
After the stellar performance of the Magnificent Seven in 2023, several concerns about market concentration have arisen. As you can see in the chart below, the Magnificent Seven collectively represent approximately 29% of the market capitalization of the S&P 500. This is the highest level for the largest 7 stocks in the S&P 500 over the last 45 years!
Given the magnitude of the market returns and the significant market concentration, a number of strategists have suggested that the recent returns of the Magnificent Seven are unsustainable. Some have even suggested that these stocks are in a bubble. We will only know the answers to these questions several years into the future with the benefit of hindsight. But for now, we ask ourselves the following question…is it unusual for a small group of stocks to generate the lion’s share of stock market returns? To put some numbers on this, let’s use 2023 as a starting point. During 2023, 1.4% of the stocks in the S&P 500 (The Magnificent Seven) generated 62.2% of the total return for the S&P 500. Fortunately, there are some academic studies that can help us compare the stock market returns generated in 2023 with market returns generated in the past.
According to a study by Hendrik Bessembinder, history has shown that a narrow group of stocks has driven the majority of equity market returns over a long period of time. For the purposes of his study, equity market returns were defined as the excess returns generated by stocks over and above what could have been generated by investing in U.S. treasury bills. The study also refers to these excess returns as net wealth creation. The study included data from 1926 to 2022 and it included 28,114 publicly traded companies in the United States over this period. The output from this study confirmed that a very narrow group of stocks has generated the vast majority of net wealth creation over the period. To be more specific, 317 companies (or 1.1% of the stocks in the study) generated 80% of the total net wealth creation; 528 companies (or 1.9% of the stocks in the study) generated 90% of the total net wealth creation; and 966 stocks or (3.4% of the stocks in the study) generated 100% of the net wealth creation. These figures can be seen in the chart below.
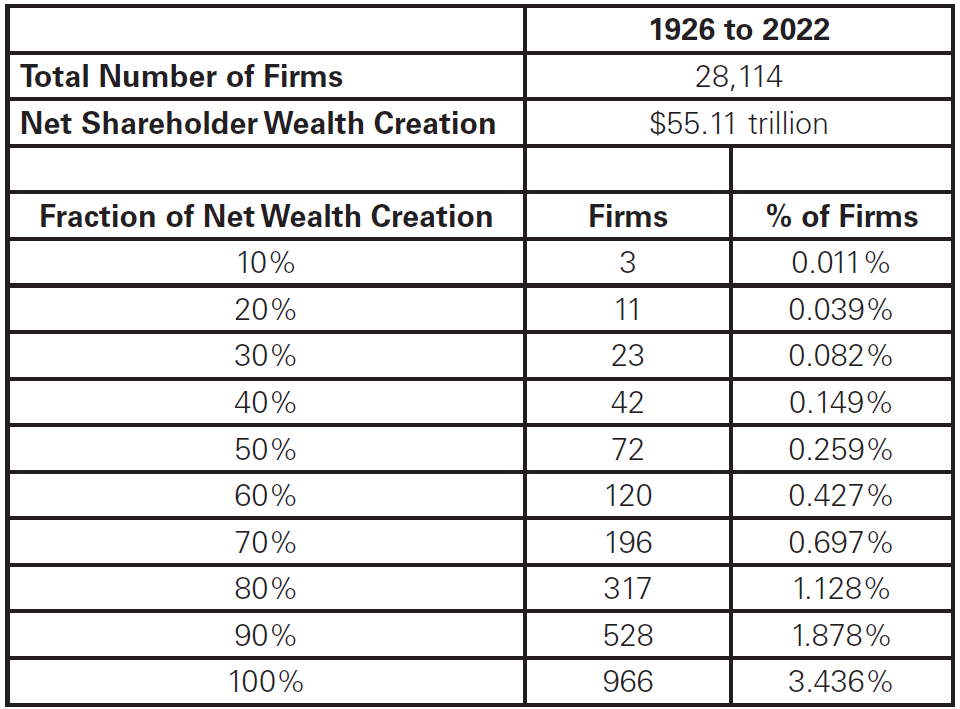
When the results of this study are compared to 2023, the returns from the Magnificent Seven do not appear to be abnormal. In 2023, 1.4% of the stocks in the S&P 500 generated 62.2% of the total return for the S&P 500. Over 96 years (1926 to 2022), 1.9% of the stocks in the United States have generated 90% of the net wealth creation.
In conclusion, we don’t believe that there is anything unusual about the returns generated by the Magnificent Seven when taken in a historical context. There is no question that the Magnificent Seven generated spectacular returns in 2023 and it wouldn’t be surprising if this exclusive group of stocks experienced a period of weakness after generating supernormal returns in 2023. Having said that, we believe that it’s likely that some of these Magnificent Seven stocks will continue to create more value in the years ahead.
