Bottom or a Bounce?
I find it hard to sort out what is really going on in the market from all the noise unless I systematically work through it. There’s the war in the Ukraine, gasoline prices over $5.00 per gallon, the Fed being behind on the yield curve and the economy is probably already in recession. When I step back, the news is pretty negative and forecasters seem to be competing to report the worst possible outcome. The S&P 500 is down 20.6% in the first half, the worst six months since 1970, while the NASDAQ, home to many of the technology companies, is off 29.5%, the worst first half on record. Furthermore, stock market sentiment is worse than what we saw at the COVID bottom in 2020 or the bottom of the Great Financial Crisis in 2009. You can usually take some comfort from this type of peak sentiment and what may be the most anticipated recession on record. For a bounce, you probably don’t need things to reverse. They just don’t have to be as bad as expected. But, for a bottom, there has to be a change for the better and when I look at some of the longer term trends, I don’t see it. But let me take you through both scenarios. And, the best way to do this is to focus on a couple of time-tested principles of liquidity and regressions to the mean.
Liquidity
We’ve always contended that liquidity will trump economic statistics when it comes to predicting the stock market. Recessions end after stock market bottoms once the Central Banks start to loosen monetary policy. Unfortunately, the inverse is also true. The Federal Reserve has embarked on a tightening cycle, which is being reflected in the market’s averages even though the economic statistics and earnings estimates are still hanging in there. If you want to understand the market, I’m reminded of an old President Clinton campaign slogan, ‘It’s the economy, stupid’. It was a reminder to his entire campaign staff that there was a singular issue to focus on. For the current market, I’d revise the message to ‘ It’s valuation stupid’. Companies, in many cases are reporting good earnings and analysts’
estimates are still rising, but the stocks are going down. Investors are frustrated with the declines and believe it’s an over reaction. But, I can tell you, having lived through the ‘70’s, you might be surprised at how far price earnings valuations can fall if liquidity doesn’t improve.
Obviously, the key to this issue is held by the Federal Reserve and other Central Banks. So, it’s worth understanding how they operate and then I’ll give you my best guess on how this all plays out. The Fed has two methods of implementing monetary policy. The first is through stated intentions or moral suasion. This is done through ‘forward guidance’ when it indicates future policy moves. It is intended to get a reaction from the financial markets and to have the markets do some of its work. It is pretty apparent in this cycle as 10 Year Treasury bond yields have moved up from last year’s lows of about one half of one percent to a recent high of almost 3.5%. It’s caused mortgage rates to escalate and is shutting down new home acquisitions. Yet, the Fed’s actual implementation of tighter monetary policy has only just begun. Rates were raised a mere 25bps in March, another 50bps in May and finally 75bps in June. That gets us to 1.5% – 1.75%, not a particularly high bar. But Chairman Powell’s rhetoric is pretty hawkish and his hero is now previous Fed Chair Volcker who took government interest rates to 18% to cap
the inflation cycle of the ‘70‘s. Forecasters now expect him to be more aggressive and anticipate two more bumps in the Fed funds rate of 75pbs in each of July and September, which will get the rate between 3.0%-3.25%. Whether this is actually being more hawkish or just shorting the cycle and getting to the same objective sooner remains to be seen.
In my opinion, Powell is no Volcker and has some other unstated objectives in mind. He has pivoted from stated policy several times in the past. Remember, his original goal was focused on employment and being willing to accept higher than normal inflation for a period of time to balance the extended period of low inflation. Now, his focus is on rising prices and bringing them under control at the expense of employment, and he acknowledges the possibility of a hard economic landing. Not what the market wants to hear. In my opinion, he has probably been intentionally aggressive to give himself some maneuvering room. Hike more now to cut expectations later. I think inflation is on the verge of moderating, but secular trends will leave it higher than acceptable. I’ll come to these shortly. Nonetheless, it will leave the Fed compromised. Do they push further to bring inflation down to target (Volcker)? They can only affect demand and employment, not supply. Or, do they declare a victory at higher than normal inflation levels to save jobs? My bet is that Powell pivots and backs away from aggressive tightening.
As I said earlier, things don’t have to get better to cause a market rally. They only need to be not as bad as expected. Inflation coming off the peak and Powell taking his foot off the monetary breaks would constitute the conditions for a bounce. Furthermore, this would not be inconsistent with other Fed tightening cycles where the central bankers backed off to preserve growth and employment. My challenging the government’s resolve already has a real case example. The European Central Bank (ECB), even before they have started to raise interest rates, has had to relent on Quantitative Tightening by providing a new, yet to be unveiled, bond buying program to prevent government bond spreads from widening and impairing the borrowing ability of certain countries such as Italy. The ECB feels that it needs to continue to intervene.
Furthermore, I think there are some things that the Fed isn’t telling us. First, it will require significantly higher interest rates to cause the kind of demand destruction that is required to bring demand and inflation down to their stated goal. Second, I think they are willing to suffer stagflation to save jobs and avoid a serious economic downturn and bear market in an over leveraged economy. Financial Repression could be the undeclared goal to deal with the bloated size of government debt to GDP. This has been practiced in the past, most recently after WWII, to reduce the debt burden by holding interest rates below inflation to create a high nominal economic growth rate, but one that is low after accounting for inflation. When revenues and wages go up they are taxed, but bonds, after inflation, get devalued. In the 70’s nominal GDP kept climbing from the economic peak of the cycle in November, 1973, to its trough in March, 1975. But in real terms from peak to trough GPD dropped by 3.1%.
Regressions to the Mean
Most of the market’s decline can be attributed to the rise of interest rates, which causes an increase in risk premiums and higher discount rates. That’s analyst-talk for lower valuations. Price earnings ratios, a measure of valuation, have collapsed for the S&P 500 from about 22.5X at the beginning of the year to roughly 16X. That’s a 27% decline, and it is even worse for some of the big cap growth companies such as Amazon and Facebook.
This isn’t unusual for a market correction. What is generally required for a Bear Market is a recession and earnings deterioration. So far, you’re seeing softening economic data but not a collapse and no declines in earnings estimates. If a downturn isn’t coming, this market is a buy as a recession is now being factored in.
My problem is that I see a number of secular issues and trends that are regressing back to the mean, which I find troubling and will result in an extended headwind for the market. Let me take you through them.
1) Profit margins are still near all time highs. They reached current levels in the 1960’s and then were eroded from roughly 12% to 7% by the 1980’s as companies couldn’t pass through cost increases.
2) Risk. Low interest rates have required investors to take on more risk to achieve the same return objective. Investors have moved out of their safe GIC’s into longer dated bonds. Or they have moved from government bonds to corporates and even out of fixed income to equities. But to get a reasonable rate of return one has had to take on more risk. And some of this is benign. Even if you stayed with bonds, which did well in a declining interest rate environment you might not have appreciated that as the coupon rate approaches zero, the volatility risk gets transferred to the principal amount of the bond. The first quarter of this year saw the worst bond market on record even though interest rates went up only modestly. As investors come to grips with this new volatility and experience some negative results, they may be inclined to step back a little and look for safer returns and move away from equities.
3) Credit Spreads. One of the hallmarks of a Bear Market and distressed conditions in the financial markets is a widening in the interest rate spreads between government issues and those issued by corporations. These spreads have started to widen, but have not reached levels seen in past recessions. If the economy slides, this will be another negative factor for the market.
4) Earnings. As I said, earnings forecasts are still close to their highs and don’t reflect the worsening economic conditions. Consequently, valuations may be understating how much lower this market could go. Second quarter earnings releases could give us some insights as managements will get a chance to provide earning and business guidance for the balance of the year. But, I would be surprised if the current estimates hold up.
5) Liquidity. From 2009 until recently, we have seen an unprecedented amount of liquidity pumped into the system. Initially, it did not make its way to Main Street, but instead flooded into the financial markets resulting in an extended bull market in stocks and bonds. Recently, that excess funding has found its way into residential real estate. The Fed is now embarking on Quantitative Tightening that will remove $1.14 trillion dollars from the system over the next twelve months. We’ll see if they actually follow through, but if liquidity is key to a bull market, this is not a good sign and in my opinion will effect Wall Street more than Main Street not unlike what we saw in the 70’s.
Secular Inflation
There are other trends that I see reversing that are more specific to inflation. If I’m right on these, they support the case of stagflation.
1) Wages. Labour’s share of GDP has historically averaged about 66% and it has dropped to around 59% and they want it back. Demographics say we have run out of workers with almost two job openings for every unemployed person. With baby boomers retiring, we face a continued shortage of workers.
2) Housing. Over the last couple of years, the price of a median home has appreciated roughly 33%. With higher mortgage rates, home ownership is out of reach for many and they have turned to the rental market, which has seen the rent for a one bedroom apartment rise by 20%. This is getting fed back into homeowner’s equivalent rent which is about 42% of the Consumer’s Price Index (CPI).
3) Energy. The price of oil has been aggravated by the Russian- Ukraine War but is hardly the underlying cause. It is due to a colossal miscalculation of governments and environmentalists in transitioning from carbon-based fuels to renewables.
4) Globalization. China has provided the antidote of cheap labour and cheap goods that has offset loose monetary policy for years. Now trade wars and unreliable foreign sourcing and security issues are causing manufacturers to re-examine their supply chains. It’s resulting in manufacturing moving out of China and in some cases returning to North America while others are adjusting their inventory levels from just-in-time to just-in-case. Either way costs are going up.
5) Regulation. I haven’t mentioned this one before but regulation, besides monetary and fiscal policy, is one of the ways the government can control the economy and the role of regulation is reversing. Deregulation, tax cuts and free trade are good for corporate profits and bullish for the stock market.
Policies that promote income redistribution, higher taxes, industrial re-regulation, organized labour and
protectionism are bad for economic growth and stock prices. (Please accept these as over-generalizations as even I would argue that the capitalist system has some excesses that need to be addressed.
Pro-growth government policies dominated by supply side reforms, free market capitalism and globalization from 1980 to 2010 are beginning to reverse. The Trump Administration started the process with a trade war with China. Biden wants to tax and spend while pursuing an aggressive green agenda and continuing trade protectionism. As an example, it is estimated that California’s new restrictions on driver classification will take tens of thousands of truck drivers off the road according to the Wall Street Journal. Meanwhile, President Xi is aggressively regulating China’s platform companies, centralizing power, marginalizing private business and pursuing ‘common prosperity’ by forcing the rich to pay more.
Global geopolitical tensions are rising. Europe is already in a war. China – US tensions continue to rise and Western Europe is re-arming while Japan plans to spend more on defense.
Unfortunately, I don’t see any easy solutions for some of these issues and I don’t think they will favour the financial markets.
Stock Market
When I look at some of my individual portfolio holdings, I’m impressed by how cheap they are. On a one-off basis, there are a number of companies that I’d buy because they seem too undervalued, and eventually that’s what will put in a market bottom. But liquidity and valuation may be the headwinds for a general market advance.
The market has already discounted higher interest rates and is now discounting a recession, which my secular factors would suggest is likely. Nonetheless, a lot of damage has been done to the market. If the trends are cyclical, then we’re probably getting close to a bottom on a stock-by-stock basis. We’re oversold and due for a rally, which could be triggered by some relenting of inflation and the Fed backing off from its aggressive posture, my not as bad as expected scenario.
However, if we do enter a recession there will probably be another leg down as earnings get revised. If it results in stagflation, the earnings drawdown may not be as great, but higher interest rates and limited liquidity will continue to erode valuations as we saw in the 70’s. Back then, we endured a decade long bear market where stocks made little progress, but earnings expectations were met most every quarter. From 1970 to 1989 corporate profits grew 4.7 fold, which equals an 8.4% annualized rate in a period of high inflation and rising inflation. From 2000 to 2019, corporate profits expanded 3 fold, equal to 6.1% annualized in a period of low inflation. Inflation in the 70’s depressed PE ratios as the average multiple for the S&P was only 12X. Multiples expanded by 85% since 2010 even though the US economic growth had been weaker than the previous decade.
Another differentiating factor is what we refer to as the Fed Put. This has been the Central Bank’s response to falling or troubled financial markets. In the last two decades, the Fed has been able to dramatically lower interest rates and provide liquidity at any sign of trouble because inflation was in a secular decline. In the 70’s, there was no such option and the Fed in fact raised rates even during economic slowdowns to fight inflation. Similarly today, it is highly unlikely that Powell could justify a reversal of his tight monetary policy because of a weak stock market. It will no doubt require a financial accident to cause a sudden reduction in rates.
So, there’s a realistic case for a bounce, but a bottom may be a bit more elusive and when it does come a new bull market will require a pivot to monetary easing.
In the meantime, remember this market is all about valuation and liquidity. With unemployment at 3.6% headed to 4.2% (Fed’s est.), we’re not likely to have much of a recession. Earnings, however, could suffer from margin compression as this monetary policy cycle hurts Wall Street more than Main Street.
The Invasion of Ukraine is a Game Changer
In my last commentary I suggested that Russia’s invasion of Ukraine would aggravate inflation and slow economic growth, but not necessarily drive the US into a recession. However, Europe may not escape that fate as the overall environment for the global economy has worsened. The game changer is that the Ukrainian invasion has caused governments to reassess their energy and trade policies. Even with an eventual resolution of the conflict, it is unlikely that everyone will resume relations with Russia as though nothing had happened. Energy policies will reprioritize the battle between the environment and security. As I also suggested, this conflict may have grabbed the headlines, but I still think the real issue is how things play out with the Federal Reserve and this market “noise”, albeit heart-wrenching and disturbing, will eventually have to be factored into the bigger picture.
In the meantime, the market is focused on Europe, is oversold and would respond positively to any resolution to the Ukrainian conflict. The downside is the potential for the conflict to escalate, draw in NATO or go nuclear. Remember, it is in Putin’s best interest to appear unstable, which makes his threat of irrational options more plausible. What’s the old adage, “Crazy like a Fox”?
But, as the Ukraine moves off the front page, I think we’re going to refocus on where we are with monetary policy and the economy.
First Principles
To survive emotional markets, you have to rely on some time-tested principles to ground your decision making. We’ve talked about liquidity trumping economics and reversions to the mean many times. So, I thought it might be appropriate to start off with some of the basics as a foundation for our current thinking.
Let me start with the Phillips curve, which most of us learned about in Econ 101. It hypothesized that lower unemployment and tighter labour markets equated with higher wages. At the end of 2019, unemployment hit 3.5%, the lowest in decades and inflation remained muted. We were also still in the midst of a very loose monetary policy that hadn’t been reversed after the financial crisis in 2009. Academics concluded that the macro forces of technology, demographics and globalization in manufacturing had refuted the principle. COVID brought another dose of stimulative monetary policy, which drove demand for goods beyond the supply chain’s ability to deliver. We’re now back to 3.5% unemployment and wage rates, if you can hire someone, are going through the roof. So, Phillips is back in vogue. Some suggest that productivity will offset the lack of labour and we agree to some extent, but we saw this movie back in the 1970’s. The trouble is, back then, the baby-boomers were graduating from university and joining the labour force creating additional supply. Today, those baby-boomers are retiring and aggravating the shortage. So, I wouldn’t count on wage price escalation being transient and it is one of my core inflation components. This is a principle, reverting back to the mean.
The money supply theory, as promoted by Milton Friedman in the 1960’s, suggesting that more money chasing the same number of goods would cause inflation, was also questioned. After all, the Fed had been pumping enormous amounts of money into the system since the Great Financial Crisis without having any real impact on inflation. So, that theory was also dead. In that first episode of Quantitative Easing, the Fed used the commercial banking system to execute its policy. That’s traditionally how it was done and was referred to as exogenous money. But the banks didn’t lend it out, and therefore it never became excess to the system. With COVID, the Federal Reserve decided to go direct, and helicopter money, via the so-called endogenous approach. They funded the government instead of the banks, and the government distributed those funds through COVID benefits. And sure enough, people got bored sitting at home and went shopping with those dollars, and we all now know what has happened to the cost of just about everything from houses to autos since then.
This is part of the thinking behind Modern Monetary Theory (MMT) promoted by neo- Keynesians who still believe the government can print and spend money without limit or consequence. They also still hold that, in theory, the excess funds sitting in savings that was created by these policies will not be consumed or invested. The Monetarists disagree. They think there remains too much money chasing too few goods, which is supported by history. Statistically, the Fed engineered a massive 40% increase in the quantity of money against a backdrop of a relatively small change in nominal GDP since the end of 2019. From 2009 to 2022, monetary policy and inflation have disconnected with CPI averaging barely 2% while money supply grew an average 6.5%. Simplistically, the excess liquidity didn’t generate inflation as China provided the antidote of lower goods prices and cheap labour. Consequently, that excess liquidity went into financial assets, stocks, bonds and real estate. We still think the fuzzy thinking behind MMT will be challenged as the reality of recent Fed policy becomes apparent and you know my thoughts about liquidity. This is another theory that is coming full circle.
My point here is that there were a number of principles that were challenged due to circumstances, mostly China and globalization, that are now reverting back to reality. And the flip side to this is monetary policy and excess liquidity. There are some mitigating factors, but less liquidity is not good for financial assets.
There are a couple of other macro trends that also appear to be regressing back to their prior means. One is labour’s share of GDP, which historically averaged around 66%, but has dropped to around 59% and they want it back. It’s part of the social movement we’re seeing as workers feel that they have economically fallen further behind, and it is partially true. But some of this can be blamed on government policy that on the surface espouses transfers from the wealthy to the less fortunate. The fact is, Fed policy has benefited those who own stuff, generally the wealthy whether that be a house, a business or investments. Liquidity went to Wall Street not Main Street.
Wages are now going up, but not as fast as inflation. You may get a raise, but you still can’t afford to fill your car with gas, let alone have enough left over to take your family out to a movie and McDonalds. So, the support for unions is increasing and the Biden administration is one of the most pro-labour governments in recent memory. This fair sharing between labour and capital isn’t going to go away with a shortage of manpower.
This has a bearing on another factor that has swung to an extreme: profit margins. Before inflation took off in the mid 1960’s, corporate profits were about 12% of GDP, close to what they are today, and profit margins were also extended at that time. But with persistent inflation by the 1980’s, that couldn’t always be passed on, corporate profits decreased their share to 7% of GDP. Some of the things that later contributed to margin improvements such as lower labour costs, thanks to China and lower interest rates, thanks to the Fed are now reversing. So, corporate revenues will likely continue to rise due to inflation, but shrinking profit margins may hold profit growth in check, which is probably not good for stock valuations.
I could go on, but I think you get the point. There are some secular factors that have favoured financial assets that seem to be peaking out and potentially reversing.
What this means for the stock market remains to be seen. One thing is sure, I don’t sense that the wind will remain at our backs, so I’m cautious. However, where do you go when inflation heats up? Rising interest rates won’t be good for bonds, while equities have historically been a better hedge than other assets. I think the real issue is what you own. Companies that can respond to inflation by passing costs through will do better than those who can’t. So, stock selection, I think, will be paramount in contrast to indexing or trend following.
So, let me get a little more granular.
Energy
Every time you fill up your car or pay a heating bill you see the impact of the Ukrainian invasion. Europe is hooked on Russian gas, and oil, and there is no short-term solution. Morgan Stanley recently did a report that provides some perspective with respect to this problem. They calculate that 80% of energy comes from carbon (Coal, Gas & Oil). 17% is generated by Nuclear, Hydro or Biomass. All of which are hard to scale, especially in the short term.
Only 3% comes from Wind and Solar, which seems to be where we are going, and it can be brought on more quickly than other options. However, look at the proportions. You can double clean energy and barely put a dent in the others, which is the essence of the problem. Environmentalists and politicians have us going in the right direction but are oblivious on how to make it a smooth transition.
Oil inventories are at a multi-year low, there is limited spare capacity even in the Arab nations, investment levels are at multi-year lows and now there is downside risk to Russian supply, which provides Europe with 30% of its natural gas. Currently, half of the US energy companies have management contracts with incentives based on environmental conservation and capital return expectations with limited increases in production.
We’ve said for some time that we see energy having a secular influence on inflation due to the miscalculation on transitioning to Renewables. This just got worse with what is happening in Ukraine. However, two investment opportunities seem apparent. Europe has to pivot away from Russia. Renewables will be the first priority, but logistically they can’t fill the gap. LNG will also be an option and the US has a sizable number of permitted projects.
I also think the US policy will have to become more realistic. As stated, domestic E&P companies are not currently incented to ramp up production and are in fact being discouraged by environmentalists. Meanwhile, the Biden administration would rather play politics and do a deal with the likes of Venezuela or Iran before partnering with a friendly neighbour to its north like Canada. At some point, security and the environment will have to be better balanced. Furthermore, as Yardeni Research suggested, Americans aren’t going to want to hear that production isn’t ramping up as fast as possible because shareholders want dividends and share buybacks. It will be considered unpatriotic. So, the predicted death of oil and gas may have been premature.
Inflation
In February, the CPI hit 7.9%, a forty-year high and that’s before the impact from Russia’s invasion of Ukraine. The politicians will want to focus on core inflation, which is running at 6.4% and doesn’t include food and energy. Explain that to your family when they are at the grocery store. Another index that just focuses on necessities such as food, shelter, gas and utilities shows that their prices rose 16% last month. Goldman Sachs estimates that every $10 increase in the price of Oil hikes inflation by 0.2%.
However, 75% of core CPI consists of services. Commodities such as autos and apparel make up the balance. Shelter is about 42% of CPI and 60% of services. In the last twenty four months, the price of a median home has increased by 33%. This eventually works its way into homeowner’s equivalent rent over about two years. In the twelve months ended September 2021, the rent of a one-bedroom apartment rose by 19.8%, which will continue to work its way into the numbers as leases roll over. Rents are a lagging indicator and are another of my secular inflation factors besides wages and energy.
So, sure, bottlenecks will get resolved and some commodity prices will come off the boil, but a sustained residual rate of inflation above the Fed’s target is highly likely.
Economy
We’ve suggested that the economy is doing fine and that inventory building and the ‘coming out’ impact on services like travel and entertainment would add to its strength. One can always find contrarian indicators but this forecast through this spring still looks accurate. However, as we move through the year things don’t look as promising. Growth is going to slow once manufacturers get caught up with demand regardless. The Russian invasion will aggravate inflation for energy, and crops, and it will create further manufacturing bottlenecks. These types of cost increases are effectively a tax. They take money out of the consumer’s pocket that could have been spent on other things. So, they slow down the economy and have recently also led to a number of forecasts for ‘Stagflation’. I won’t argue that we’re headed in that direction, but exactly where we cross over from growth to stagflation isn’t well defined. There are a lot of comparisons to the inflation of the 1970’s, which are also partially valid but beyond what we want to accomplish here.
Regardless, Fed Chairman Powell has suggested that the jump in oil prices could add 0.9% to inflation and cut nearly 1/2% from US GDP.
Those forecasting a recession point to past correlations between oil price shocks and a decline in the economy. This is supported by the earlier mentioned impact of higher energy prices on consumption and what is referred to as the Fiscal Cliff, or the lack of any further government stimulus as compared to the previous year.
But there are some mitigating factors. First, energy is a much smaller component in the household budget. It peaked at around 9.5% in the early ‘80s and has since declined to about 4%. Second, consumers have something like $3.0 trillion in surplus savings while wage growth is running close to 6%, and everyone who wants a job has one. Consumption isn’t going to fall off a cliff.
So, GDP growth will slow down, and inflation will remain stubbornly and aggravatingly high.
Federal Reserve
There was all kinds of speculation as to what the Fed would do prior to the invasion of Ukraine. Most forecasted seven increases this year starting with a 0.50% jump. That got toned down and we all now know that the Fed initiated a 25bps increase with Powell suggesting that 1/2 point increases are probable as inflation is more intransigent than expected. The reality is that there isn’t much the Central Bank can do except to use a very blunt tool to reduce demand. That leaves them with a choice between recession and enduring higher than acceptable inflation. They’re handcuffed by both their own overstimulation and by fiscal policy which has left government debt at a record $30tn, up about 30% since 2020. Even a rate increase to 2% would translate into an extra $600bn of interest payments. Powell is no Volker, so my bet is that he incrementally addresses the issue but tries to avoid a decline in the economy and lost jobs. Maybe that will be accomplished by the Fed simply adjusting what they now believe is an acceptable rate of inflation from their 2% target to 3% or 4%, and declare that a victory.
Aside from the cost of money there is its availability or liquidity issue. I see this as a bigger problem for financial assets than the economy. Although interest rates remain the focus, the reality is the level is still almost de minimis and a rise to 1/4 of one percent or even three hikes from now at 1% doesn’t seem like a very high hurdle rate that should slow things down much, except maybe for housing. However, a withdrawal of surplus funds through Quantitative Tightening (QT) is different. Earlier in this piece, I recounted that easy monetary policy executed through the commercial banks had failed to stimulate the economy but had a significant impact on financial assets. So, the next round of stimulus went direct and did help the consumer. This time QT will probably play in reverse and is likely to affect Wall St. more than Main St. as savings and the commercial bank lending play a role. The FDIC insured assets are about $11.2 tn, so 10%-15% loan growth could add approximately $1.1 to $1.7 tn to money supply to counteract the QT. This liquidity will be provided to Main St. and supports economic growth. Furthermore, consumers have an estimated $3.0tn in excess savings that can be spent, which will also add to liquidity. Both sources will support economic growth and inflation.
However, the Fed owns about 1/3 of both the US Treasury and mortgage market. Its balance sheet has doubled since the pandemic to 40% of GDP. Someone will have to provide this lost liquidity. So for the Fed, the risk of policy error is pretty high as they will be tightening into an eventually slowing economy. Soft economic landings are pretty elusive even in less challenging times.
Stock Market
At the risk of getting too theoretical, there are three things that affect stock prices:
1) Changes to a company’s growth rate,
2) The discount rate, essentially interest rates,
3) The risk premium, the need for a higher rate of return in difficult environments.
Logically, companies that grow faster get higher valuations. Interest rates are used to discount that growth and higher discount rates lead to lower valuations. And finally, higher risk premiums translate into lower valuations. Why is this important? Because the difference between a correction and a bear market is the extent to which a contraction in liquidity and the rise in risk premiums get passed through to the economy resulting in a decline in earnings. In a correction, the price decline is usually a rise in the risk premium and the discount rate causing a fall in price earnings ratios without much change to economic growth or earnings. In a bear market, the impact of the earnings decline is greater than the increase in the risk premium or discount rate.
What we’re seeing right now is higher inflation driving higher interest (discount) rates and the Ukraine war impacting risk premiums. It’s led to a correction. The good news is that the market adjustment has not yet been credit-induced. Interest rates have only just increased, but by 25bps and no liquidity has been withdrawn from the system, except that required by the economy. Furthermore, the air is coming out of the Mega Caps, which have seen their valuations drop from 33.8X earnings at the start of the year to 26.5X. For the S&P 500, forward P.E.s have declined from 21.5X to 18.1X. Value index P.E.s have declined from 17.4X to 15.7X while growth stocks have seen valuations contract from 29.7X to 22.3X as forward P.E.s are inversely correlated to inflation. So, what we have seen so far is about what one should have expected. The most overvalued sectors are seeing the greatest adjustment and value is doing better than growth because it is less adversely affected by interest rates and has a better ability to adjust prices and pass-through inflation.
So, where do we go from here? Right now, you can’t build the case for a bear market based on a recession, although things are going the wrong way and the Fed seems to be caught in a Catch 22 with rising inflation and slowing growth.
What gives me the greatest concern are the reversions that I mentioned earlier. Inflation and especially higher wages will have an impact on profit margins, which will curtail profit growth. The Fed is going to have to drain some of the excess monetary policy liquidity that it created, oil shocks have historically not been good for the market or the economy and lastly, the Fed can no longer provide a safety net for the market. In past market declines, the Fed has been there to lower interest rates and inject liquidity. This time it would seem that they have few bullets left to fend off a Bear.
Excess savings and bank liquidity will initially temper any impact on the economy, but I doubt that it will save Wall St. as the funds will be needed for energy transition projects, defense, inventories (just in case) and re-shoring projects filled with productivity-enhancing robots. Risk premiums and discount rates will go higher impairing improvement in the market averages. But, there will be pockets of strength for selective investment made in the right areas. Riding the trends or momentum and indexing will be last decade’s investment strategy. We’re now back to playing some defense and old fashioned stock selection.
Putin vs. Powell
I’m not a fan of Vladimir Putin. I think he’s a thug. But, if you’re going to resolve a conflict you have to understand your opponent’s position. What I’m seeing happen in the Ukraine reminds me of the Cuban Missile Crisis in 1962. It was a period during October of that year when we thought there was a chance there would be a nuclear confrontation as the Soviets threatened to put missiles into Cuba. Khrushchev had misjudged President Kennedy as being a weak President. He had failed in the Bay of Pigs invasion in 1961 and failed to take action against the building of the Berlin Wall. The hypocrisy of the standoff was the US intolerance of missiles close to their borders in Cuba while they were installing ballistic missile bases in Turkey. History suggests that Kennedy won the contest with a blockade and the Russian withdrawal. The reality is that Kennedy agreed to end his threat by pulling his weapons back from the Soviet borders.

If you look at this map, you can see how the NATO Allies have continued to sign alliances that encroach on Russia’s borders. So, maybe there is reason for their paranoia, especially with a leader that envisions restoring his country to its former greatness. Although global economies have advanced dramatically since the Cold War era, we’re still dependent on the movement of commodities and this latest conflict with the Ukraine is highlighting this.
Historically, geopolitical crises have tended to be a buying opportunity in the stock market and most strategists are siding with history. Given that the current market was already in a slump due to Fed Chairman Powell’s shift towards a tighter monetary policy, Putin’s actions have driven investor sentiment to an extreme that is usually bullish, at least for a bounce but maybe not a bottom. With inflation running hot and interest rates already low, there is little leeway for the Fed to provide market support. However, in the battle for headlines, I think Powell will regain the advantage and push Putin off the front page. Nonetheless, it’s worth trying to assess how Mr Putin has altered the landscape since the end of the Olympics.
At year end, we felt that the economy had one more advance left in it, as bottle necks got resolved, inventories were rebuilt and consumption shifted from goods to services. Inflation was likely to hang around as labour shortages aggravated wage settlements, housing costs got passed through in higher home equivalent rents and oil prices remained high due to shortages brought about by environmental capital blockades and insufficient sources of alternative clean power to make up for declining hydrocarbon reserves.
The Russian economy isn’t one of the top ten in the world. So, it’s not likely to impact this outlook very much. However, at the margin, what is going on in the Ukraine can change the complexion. Especially if things escalate.
So, what’s changed since the year end? Let’s start with the sanctions against Russia for the invasion:
1. The natural gas pipeline, Nord Stream 2, from Russia to Germany has been put on hold.
2. Access to high tech items such as semiconductors has been limited.
3. Travel bans and asset freezes were implemented on targeted individuals and politicians.
4. Trade and finance restrictions were initiated against selective banks and bond financings.
Sanctions were determined so as to not hurt Allies and to avoid unintended consequences. On balance, the actions taken were considered pretty mild and probably ineffective. Putin himself was not restricted and the nuclear option of barring them from the international monetary settlement system, SWIFT, was not taken.
Yet, there will be ramifications. The unintended consequences are not yet known and one would assume this first round of sanctions is just part of the sequencing that will unfold as reprisals for any further Russian aggression. So, things could and will likely get worse.
Let’s start with oil. No one wants to aggravate the price of energy. It would be too painful for Europe and US voters are already upset by the cost of gasoline. But, oil is also moved by ship and insurance companies are already either raising the cost of insuring cargos or are refusing to insure due to war risk. Refiners are looking to source crude from other locations further aggravating shortages. In the unintended consequences categories, Biden may be more motivated to come to a nuclear treaty with Iran to bring their crude oil back to the market. Where would this leave the Israelis? They have proven to not only have the capability for military action but the willingness to use it. Do they end up feeling threatened and without creditable US support, given Biden’s actions in Afghanistan, and do something unilaterally that provokes a Middle East war? Furthermore, there is the Taiwan wildcard. Everyone knows China’s stated intentions to reunite with the Island nation and Western alliance’s opposition. Does successful aggression by Russia encourage them to move on this issue? Right now, China is in its own balancing act trying to maintain a united front with Russia while avoiding being associated with destabilizing acts against some of its biggest trading partners. They have suggested that they may not support a full-scale invasion and have called for a diplomatic solution while condemning sanctions. One would assume that they will watch to gauge the West’s reaction in their deliberations on Taiwan.
Furthermore, you cannot assume Russia won’t unilaterally reduce its exports to further their negotiating power. They’re the world’s largest exporter of natural gas, supplying Germany with 40% of their requirements. They are also one of the world’s largest exporters of wheat and provide 10% of the world’s copper and aluminum. After the Crimean annexation, sanctions put Russia into recession as oil prices were declining. This time oil prices are improving. Additionally, they’re in a much better financial position with a current account surplus equal to 5% of GDP. Their sovereign debt is only 20% of GDP, amongst the lowest in the world with gold and foreign exchange reserves amounting to about $600bn.
One could go on, but I think you get the message. There are a lot of moving parts and we don’t yet know if there are further moves in store.
Conclusion
The economic recovery and inflation outlook we envisioned earlier remains intact. Although, the Russian invasion has probably aggravated the inflation outlook, especially for energy, and detracts from economic growth as higher oil prices are a de facto tax on consumption and will foster more concerns over stagflation.
As for the stock market, we got the type of reaction that one would expect. Initially interest rates declined due to a flight to safety that also pushed the US dollar higher. But once the shooting started, shares rallied from a very oversold condition and the most depressed growth issues that benefit from lower rates led the advance. But, interest rates didn’t stay depressed very long and recovered quite quickly which retuned the market to its earlier mode of favouring value and commodity producers over mega cap growth stocks.
Without further escalations in the Ukraine the headlines will probably once again focus on the Federal Reserve and their policy meeting on March 16th. Tighter monetary policy and whether the European conflict will moderate the expected rate increases and hurt global growth, will likely dominate market forecasts.
The big risk is that the Ukraine conflict escalates and spills over into Baltic States which may have NATO treaty obligations.
Subsequent Events:
Over the weekend sanctions were escalated. Certain Russian banks have been restricted from using the SWIFT payment system. However, this is more of an inconvenience than it is punishing. What was punishing was the prohibition against banks providing US dollar transactions. This eliminates a lot of trade.
Sanctions have also limited Russian access to their Reserves and prevents them from defending the Ruble which has collapsed by 40%. The lower currency will aggravate inflation, which is already running at 9%, and some believe this will take it to 18%.
To defend their currency, Russia’s Central Bank has doubled interest rates to 20%.
Obviously the sanctions are intended to cause domestic economic pain while sparing energy users any additional burden.
Gerald Connor
Chairman
Delay of Game
A football analogy seems appropriate at this time of year and is also an accurate assessment of the economic recovery that we anticipated last fall. It has been delayed by the Omicron variant. For how long? Well, that might depend on where you are and your perspective on things.
If you’re in Quebec, you’re not only shut down, you’re shut in with a curfew. Ontario isn’t too sure what to do. You can’t go to a restaurant or your office, but your kids can go to school. Well, I’m currently in Florida and it is open for business. The sentiment here is ,”Bring it on and let’s get this over with”. They’re more concerned about dying than getting sick and this latest variant seems to be mild and less serious. So, either get your shots or get sick, but either way let’s get to “herd immunity.” Besides, even if you’ve been vaccinated, you’re still probably going to get it. Omicron is the fastest spreading virus known to mankind. According to the infectious disease experts at Massachusetts General Hospital, one case of measles, until now the most infectious virus, would cause 15 new cases within 12 days. One case of Omicron gives rise to 6 new cases in 4 days, 36 in 8 days and 216 in 12. A simple extrapolation would suggest 14 million people will be infected in 60 days compared to 760,000 for measles.
Are they right and as Canadians are we being too cautious? I don’t know the answer to that, but I can tell you that I’m having more fun down here than I would be sitting around a wood burning stove watching Netflix on Saturday night up north.
So far, the market seems to agree with the “let’s get on with it” view and that this latest wave will flame out sooner rather than later. Infections along with vaccines will result in herd immunity.
So, what are our thoughts? Well, not much has changed since my fall commentary except the recovery we expected has been pushed out by a couple of months due to Omicron.
Our thinking then was that liquidity drives the market and there was still lots around. And, that the economy would recover as bottlenecks got resolved and most importantly inventories got rebuilt.
Maybe it’s best to just revisit last quarter’s thinking and give you an update.
Economy
Last quarter we pointed out that there were two economic camps. One believed that economic growth was about to slow as government stimulus was behind us. The other camp, which we supported, believed that there was still pent-up demand due to supply shortages and that the service sector, think airlines, hospitality and restaurants, had yet to open up. This will show up in real final sales, about 75% of GDP. However, another important factor in the GDP calculation is inventories. When they are increasing, they add to GDP growth and today they are still very low and likely to expand which keeps manufacturing companies busy. This trend is being exaggerated by company’s reactions to the supply shortages and bottlenecks by holding more inventory than normal as security. The Atlanta Fed’s GDP Now model suggests that the economy grew at a 6.8% annual rate in the fourth quarter with real domestic investment growing at 17.8% as businesses try to improve productivity in the face of chronic labour shortages. Job openings still total 10.56 million, which amounts to 1.5 available jobs for every unemployed worker. However, this level of growth is unlikely to be sustained once pent-up demand and inventories are satisfied. Manufacturing will recede to production levels that more closely match final sales and that is probably the best-case scenario.
Realistically, companies are likely overestimating demand by extrapolating current sales and are double ordering to press manufacturers for product. It is also likely that a lot of demand has been pulled forward by stimulus checks and current sales levels will not be maintained. Furthermore, year over year comparisons start to get tough in the second quarter as we anniversary huge government stimulus which then, in contrast, becomes a drag on economic comparisons. Employment gains and savings can offset this for a while, but as employment gains reaches limits and savings are spent, there will be little follow up for further consumer spending. You also lose some remaining fiscal stimulus. February 1st, 39 million students will again be obligated to make payments on their student loans of $300/ month. That amounts to $22 bn per month or $144 bn per year of drag. The childcare tax credit of $300/ month also ends in May. As we go through this normalization one should expect to see economic growth revert back towards a trend of 2% and this could be threatened by a Fed that has to respond to above target inflation.
Inflation
Inflation has been another controversial issue. We’ve consistently said that we think it will recede from the current spike which reached 7% in December, a forty year high, but that it wasn’t going to go away and would remain stubbornly above acceptable levels. The Federal Reserve seems to have come around to our view as their repeated use of the word “transitory” has now been replaced with the word “persistent” as they see the current economic outlook as much stronger with higher inflation and tighter labor markets than at the beginning of previous normalization episodes.
Our belief that inflation starts to subside is based on our expectations that pent up demand for durable goods, which have lead the consumer price inflation, would largely be met by the second half of this year as supply chain bottlenecks get resolved. Yet, a number of economists are now projecting inflation to slow only to 3%-4% in the second half of this year and to remain elevated around that level though 2023.
Our elevated inflation expectations are based on three secular trends that we think will persist. The first is employment costs. Not long ago, the Phillips curve that says tighter employment leads to higher wages was dismissed as old thinking. Globalization had eliminated the correlation. With factories moving out of China and re-shoring, we’re once again dependent on domestic labor. And there is none. The working age population in the US is barely growing as the excess demand for workers was met by the baby boomers, the first of which are turning 75, remained in the work force. This population bubble pushed the percentage of workers aged 16-34 from 37% of the labor force in 1962 to 51% by 1980. It has now fully contracted to 35%. However, Covid has caused a rethink here and a number of those who extended their careers are now retiring. Immigration which also supplemented the work force was further curtailed by the Trump administration. We are now back to the pre pandemic unemployment rate of 3.5% a 50 year low. Not surprisingly, the average hourly earnings for production and non- supervisory workers, about 80% of workers, rose 5.8% in November. Furthermore, the Biden administration is probably the most pro-union administration of modern times with popular support of unions reaching levels last seen in 1965, which could exacerbate this trend. It’s true that productivity improvements can relieve the situation, but the capital that is required is also in competition with environmental demands and proponents of better fair sharing between capital and labor. Consequently, we don’t see this as a transient issue.
Our second secular inflation issue is the cost of housing. With record low mortgage rates, thanks to the Fed and their monthly purchase of mortgage-backed securities, home prices have appreciated by 30.3% since pre pandemic levels and prospective buyers are priced out of the market, which is boosting the demand for rental units. With interest rates going up, this will not get any better. Owner’s equivalent rent, which is a concocted calculation thought up by some career bureaucrat, represents about one third of the consumer price index, CPI, and is intended to calculate what a homeowner would pay himself to rent his own home. It usually lags the actual housing market price action by about one year and is currently running at 3.5%. With pressure on rental rates, this homeowner’s equivalent is likely to remain under upward pressure.
Our third secular concern is energy and is based on an ill-conceived transition process from fossil fuels to renewables. Between political pressures and environmentalists, our energy security and economic progress could be in jeopardy. World crude oil production remains 8.4% below 2019 year end levels and US supplies are still almost 2.0 million barrels per day short of where they were pre-pandemic. Oil and gas discoveries are on track to hit the lowest levels in 75 years while exploration is inhibited by the banks’ reluctance to lend to the industry due to political risk. Yet China and other growing economies will see their consumption of oil continue to grow for decades to come. Furthermore, coal which is the primary fuel used to generate electricity is expected to reach record levels of consumption this year in China, India and the US. Transitioning to renewables is not likely to be smooth and could result in economic disruptions and/ or more inflation, not to mention security threats as the US loses self-sufficiency and once again becomes reliant on the Arabs and Russia.
Bottom line, we don’t see how Federal Reserve policy can affect these trends unless it wants to restrict the economy and demand.
Federal Reserve
Our other big theme centers on liquidity. When there is more of it around than the economy can absorb, it goes into the stock market. As inventories get rebuilt and the economy expands, there will be greater demand for those surplus dollars. However, the supply of that liquidity is also under re-assessment. The Fed has been focused on employment first and inflation second in reaching its twin mandated goals. With unemployment at 3.5% and inflation running at 7% they seem to be in a position to declare a victory and possibly be labeled as over achievers. So, how do they back off without triggering some unintended consequences? We all know they have to reduce liquidity and eventually raise interest rates. What remains unknown is how fast and how far. The minutes of their meetings give us some insights and suggest they are incrementally moving from accommodation to normalization much quicker than what was assumed. They also show that their ability to forecast, even given all the resources that they have, isn’t much better than average. In their December 2020 meeting, they predicted that inflation would be 1.8% for 2021. By March, that projection had risen to 2.4%; by June to 3.4% and 4.2% in September. But they continued to project 2.2% for both 2022 and 2023. Meanwhile real yields, the difference between interest rates and inflation, have gone to record negative lows, which would suggest that either rates are too low or inflation has to come down. We’ve already given you our opinion on inflation. To adjust for this, we now have all 18 members of the Fed Open Market Committee expecting at least one rate hike in 2022 up from nine in September. Furthermore, 12 of them think there will be as many as three, one quarter point, hikes and two think there could be four increases. In 2023, three more increases could be in the offering which would bring the policy rate to 2.1% by 2024 compared to 2.25%-2.50% in 2018, the previous cycle high. In response to these quickly changing realities, the Fed has decided to accelerate its tapering program. It sounds like a reduction, but it isn’t. The new policy will in fact still stimulate the economy with added liquidity, just less of it until it ends in April with no new additional bond purchases.
So, Fed policy is still accommodative until then. Beyond this spring, things are less certain. The Fed suggested that rates could start to rise once accommodation ends and they threw in a new twist suggesting that they could allow for balance sheet run off, meaning that they would actually reduce liquidity at some point after the first hike. This is the first time run off has been mentioned. As we said, this is the stuff of bull markets so the antenna goes up pretty quickly, especially since the Fed seems to be behind the curve and recent actions suggest they’re trying to catch up.
Since the pandemic started, the Fed’s balance sheet has expanded by almost $5.0 Trillion to $8.7 trillion. It was used to fund government spending which resulted in checks going out to the public, some of which made it back to the banks and show up in deposits which are part of M2. M2 is up $6.0 trillion since February, 2020 and about $3-$4 trillion above trend at $21.4 trillion. About the size of the entire US economy and is the most liquid since March 1975. How much of this liquidity is surplus is open to conjecture, but the guess is around $3.0 trillion. The government needs to borrow about $1.0 trillion next year plus whatever the economy requires. The Fed’s balance sheet is concentrated in short maturities which would result in a $1.0 trillion run off this year and an additional $1.0 tn in 2023. Things may get tight sooner than expected.
So this addresses quantity or availability of money. The other variable is price, or the cost of money, which is measured by the interest rate. If the Fed governors are correct, we get to a .75% official rate by the end of this year which doesn’t seem very high in absolute terms. Nothing that would seem to threaten the economy. Even the projected rate of just over 2% in 2023 seems consistent with what we have seen before.
Our fear is that the current rates, especially the 10 year U.S. Treasury may be giving us some false comfort. It hasn’t gone up as much as many had expected. A number of things could be causing this, which will now start to reverse allowing a realistic rate to evolve. First, a lot of the Fed bond purchases provided liquidity to the banks which then bought bonds to get it invested. The banks have also seen a lot of deposits come in with no offsetting loans resulting in bond purchases. And lastly, the US has been running enormous trade deficits from all the goods they have been importing. Traditionally, foreigners receiving payment for those goods exchange the funds and their country’s central bank buys treasuries. Trade deficits get recycled into the treasury. Both of these sources of bond purchases which push interest rates down are expected to reverse as savers buy a car and withdraw the funds, auto dealers need loans to finance their inventories and satisfied pent-up demand reduces spending on imported goods. If so, over the next few months, we’ll see the true yields on Treasuries and if inflation is still elevated so will yields. Availability of funds declining while the cost goes up may prove problematic.
Market
In the near term, conditions probably support an optimistic market outlook. The Fed, despite its rhetoric, is still providing liquidity and interest rates remain at their lows. The Omicron variant is expected to be mild and short-lived while bottlenecks and shortages should get resolved allowing the economy to resume its recovery. So, the market backdrop for the next few months still looks constructive. However, below the surface I still have my concerns. Concentration is extreme. The FAANG group has now been expanded to the Magnificent 8, Alphabet (Google), Amazon, Apple, Meta (Facebook), Microsoft, Netflix, Nvidia and Tesla. Their collective market cap is $12.1 trillion, about 25.7% of the S&P 500 total market cap and they trade at a collective 33.8X forward earnings. This compares to the S&P 500 at 21.3X and the S&P500 ex the Mag 8 of 18.6X. Apple alone is worth more than Walmart, Disney, Netflix, Nike, XON, Coke, McDonalds, AT&T, Goldman Sachs, Boeing, IBM, and Ford combined. They’re great companies and will continue to grow but their valuations are far from cheap.
We’re also seeing a diversion in breadth in the NASDAQ where roughly 36% of the stocks are down over 50%, while the averages are only about 7% below their peak. Moderating this concern is that the vast majority of these companies are small caps and may be overstating the issue. Nonetheless, the advance/decline ratio on the N.Y. Stock Exchange also peaked last June.
Overall valuation is also high but mostly due to the concentration issue. Ex the Mag 8, the S&P is not cheap but trading at a more reasonable 18.6X forward earnings. The nuances of the market are further apparent when comparing growth to value. The S&P 500 Growth index trades at 28.3X while the Value component trades at a more modest 17.1X. The growth versus value argument has been an ongoing debate, but the most predictive variable has been interest rates. Value performed well through the first five months of the year while rates were rising and lost ground when rates declined in the summer. But, if the Fed is on the verge of a tightening cycle, value might be able to show a more sustained outperformance. What might lend some further support to this is the analogy I see between today’s market and what happened at the end on the dot com era in 2000. Back then the Tech stocks were hyped by the corporate spending to prepare for Y2K. But it wasn’t sustained the following year. Last year the market darlings were those that benefited from the pandemic. But will there be a follow up for the Zooms and Pelotons or is it over? It was a defining event in 2000 when market sentiment shifted dramatically from growth to value. There are also many signs of speculation from record-high levels of M & A activity to the participation rate of the public which are concerning.
However, as we move beyond this last economic recovery phase and the Central Bankers begin to normalize interest rates the outlook becomes less promising. Earnings can continue to grow, but valuations are already high. Liquidity will diminish and economic growth by the end of the year will be headed towards a trend line 2% as comparisons become more difficult. Mistakes by the Fed or an unexpected slowdown in the economy would probably be unwelcome news. According to Alpine Macro, there have been 8 stock market shakeouts that exceeded 15% since 1990. However, there were only four recessions. The others were valuation contractions. One was induced in 2018 when the Fed then also raised interest rates and shrank the Banks balance sheet. Chairman Powell had to quickly reverse his direction. Will there be a repeat or has Powell learned a lesson and won’t go far enough to fight inflation?
Conclusion
The Omicron story likely gets pushed off the front page by the end of January in favour of the economy recovering as shortages get resolved and the inventory cycle plays out. Inflation will remain a stubborn issue for secular reasons that defy the Fed’s efforts to resolve it and potentially set it up to overreact. Slowing economic growth, high valuations in certain sectors and declining liquidity will likely make for a more challenging market environment in the second half of the year, if not sooner as the market anticipates these changes.
The by-word for the year is likely to be Normalization. Normalization for the economy as it comes off a fiscal and monetary stimulus high. And, Normalization for monetary policy as we move away from zero and negative interest rates to something more realistic.
If this results in an economy growing at 2%, a policy interest rate around 2% and inflation moderating towards 3%, the market can probably live with that.
Just don’t count on it being a smooth glide path. There are likely to be some air pockets or bumps along the way.
Gerald Connor
Chairman
Liquidity Always Trumps the Economy
We’re always asked what we think of the market. But, history shows that making predictions about the averages is a mug’s game in the short term. For sure earnings expectations, interest rates, Federal Reserve policy and the state of the economy influence the daily fluctuations. So, I’ll touch on some of these. But one of the principals that I have learned over the years is that liquidity always trumps economic statistics. You only have to go back to March 2020 for a good example. The economy was falling apart as the government shut it down as a defense against the spreading Coronavirus. If this had been your only stock market indicator, you’d have bailed out. However, coincidentally, the Federal Reserve instituted a massively stimulative monetary policy. That set the bottom for the market. That liquidity had to go someplace and as it does historically, it went into financial instruments and stocks and bonds rallied.
By most accounts, it’s still game on as the Fed is holding the short-term interest rate at close to zero and purchasing or driving $120 billion of liquidity into the bond market every month. So, by my liquidity measure, you still want to favor equities. When will this change, you might ask? Well, now you are into reading the economists’ tea leaves. Is inflation more than transient? Is the economy about to slow? Is the stock market overvalued? I’ll give you my take on these issues, but remember Warren Buffett’s warning when he said, “Market forecasters were invented to make fortune tellers look good.”
Economy
There are two schools of thought. One believes that economic growth is slowing dramatically. The government’s fiscal stimulus is behind us and the consumers that were inclined to spend the government handouts have already spent it. Goldman Sachs estimates that fiscal support boosted disposable income 9% above the pre-pandemic trend in the first half of this year. Enhanced unemployment benefits and stimulus checks are now behind us and the Atlanta Fed’s “now” forecast for the third quarter has collapsed.
The other camp believes that there is pent up consumer demand. People would buy goods if they were available, but because of shortages, they’re not. They’d also like to go to a restaurant or get on an airplane, but the latest Delta variant makes them reluctant. I’m in this camp. My decision is based on inventory levels. They’re too low. You can go into a car dealership, but there are no cars on the showroom floor. Motor vehicle sales have dropped 6.2 million units from the recent high of 18.5 million in April to 12.3 million units during September. A friend of mine recently bought a car, but was given two choices, black or white and take it or leave it. No negotiating. Sort of sounds like dinner options around my house. And, I see this in many other industries that are impacted by supply shortages or transportation delays.
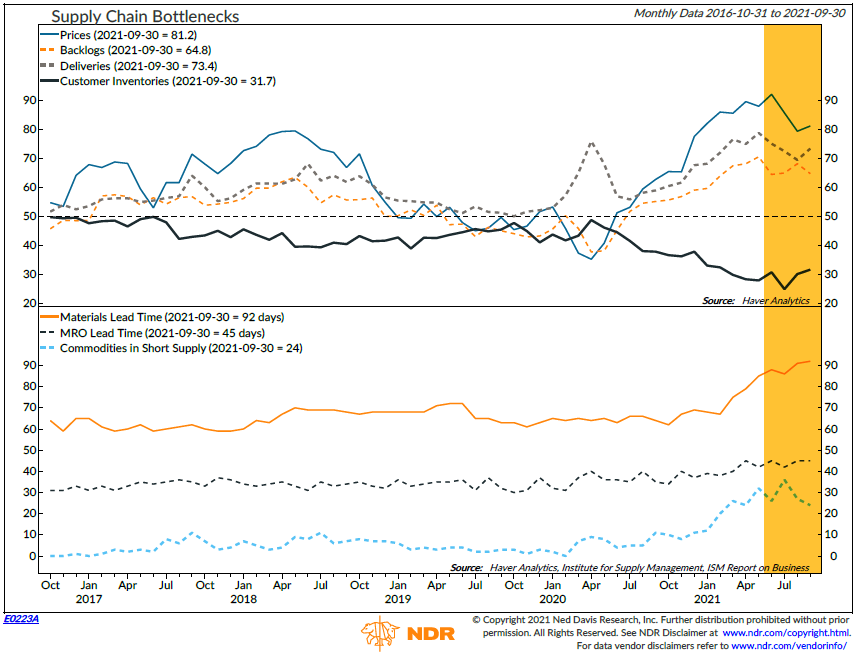
See the above chart which graphically tells this story. Prices, backlogs and delivery times are way up, while inventories are bouncing along the bottom.
We recently had Peter Aitken, TD’s investment strategist, in to give us his views. Peter has been around awhile, he’s practical and has good judgment based on years of experience.
The main theme of his outlook was based on the inventory cycle. He currently sees an economic slowdown due to this pent-up demand with nothing on the shelves and believes the situation may last until next spring before the bottlenecks get sorted out. When they do, he sees an acceleration in spending and a rush to rebuild depleted inventories. This will give the economy a significant boost. This will then be followed by slower spending but continued inventory building until a normalized level is reached. That will then be the inflection point for slower economic growth. If you accept that as your economic road map, the market should probably behave pretty well through the first quarter of next year.
In the meantime, economic forecasts for the next couple of quarters are being trimmed. But, I think the reasons behind it are probably more important to the market than the actual number.
Inflation
I said in my last quarterly that I bought into the transient theory on inflation, but only up to a point. I don’t think it will stay north of 5% as commodity prices will revert. That said, I do feel there will be a residue of pricing pressure from housing and employment costs. Housing prices are a contrived number based on what one would pay himself to rent his own home (Owner’s equivalent rent). Only a government paid economist can figure out this number, but it does tend to follow housing prices after a delay of about one year.
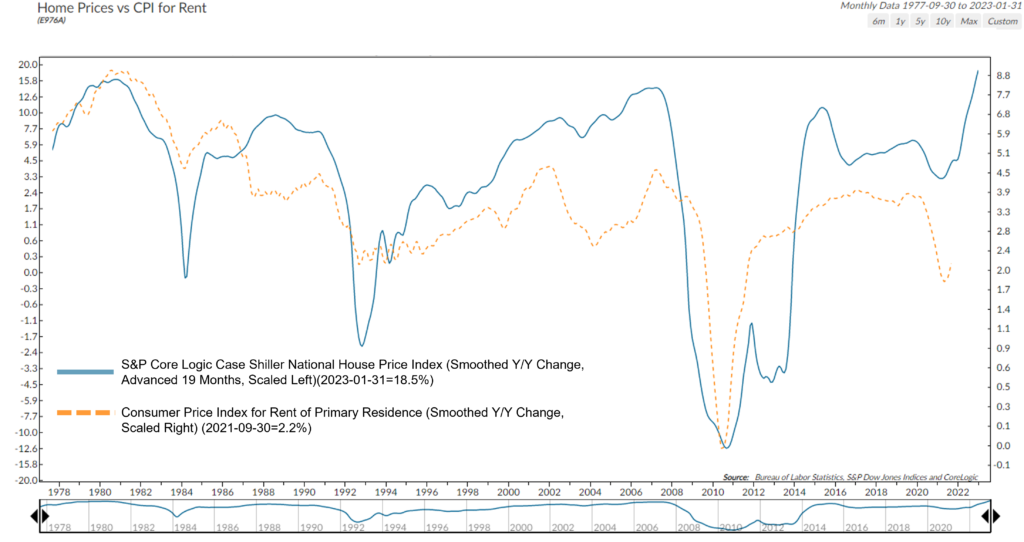
See the above chart. As for employment costs, which are 65% of corporate costs, I see two secular factors that I think will continue to drive wages higher. The first is a reversal in the globalization of manufacturing. Companies are moving production away from Asia as shipping costs and lead times rise. This is boosting onshoring as manufacturing returns to the USA and Europe or nearshoring to East Europe. This helps control the supply chain. As an example, container costs from Asia are now $10k to $15k up from $1200 – $1500 and lead times drop from 7-8 months to 2-2 1/2 months or as little as 4-5 weeks in certain locations. So, although there are still some labor cost advantages, they aren’t as great and this secular force for lower wages is reversing.
The second is demographics. Population growth has slowed in all developed countries and the working age population is falling for the first time in history. Demand for additional workers has been subsidized by baby boomers working beyond traditional retirement age and by immigration, which has provided a buffer. With Covid, baby boomers, the oldest of which turned 75 this year, are electing to retire. It’s showing up in a record high quits rate. And, immigration has diminished under Trump’s border restrictions. The leisure and hospitality industry is highly dependent on temporary immigrant workers. Nearly a quarter of the leisure and hospitality workers were immigrants leading up to the pandemic according to Yardeni Research. Altogether, employment has plunged from a record high of 31.8 million to 22 million in April, 2020. It has since rebounded to 30.2 million but is still down 1.3 million from the record.
The 3.5% unemployment rate prior to the pandemic was a 50 year low and should have been the first recognition of a labor shortage. Policy makers believe that the pandemic and unemployment benefits are causing the problem. But, when this delayed return to the work force happens we’ll be back to an unsustainable shortage. The problem is availability, not demand.
Compounding these trends is labor unrest and inflation. There have been 176 strikes launched so far this year, mostly to demand higher wages. Furthermore, support for organized labor is growing. Union membership dropped to below 11% of employed Americans in 2020 from 20% in 1983. However, 68% of Americans now approve of unions, the highest since 1965 according to Reuters. And, this ratio climbs to 78% for those aged 18 – 29. To support this trend, the Biden administration, considered the most pro-union president of modern times, has initiated a task force led by VP Harris to promote unions and labor organizing.
Inflation is also a factor. A lot of the labor shortage is due to mothers staying home. School openings is an issue but child care costs are the problem. Will someone return to a $25/hr job and pay $15 /hr or more for day care costs that have been driven higher by labor shortages. It’s a vicious cycle that will sustain wage cost pressures.
Overall, we have about 11 million job openings for about 9 million unemployed workers. The optimists see productivity relieving the problem and we don’t disagree to some extent. However, social policies are advocating a better balance between wages and capital returns and pressure on environment spending will cannibalize some productivity enhancing capital. A good example of this is what is happening in the oil and gas industry. Domestic energy companies are now diverting surplus earnings into debt repayment and environmentally friendly projects in reaction to ESG-driven shareholder demands. Oil production out of the western basin is now about 2,000,000 barrels per day lower than pre-Covid. Meanwhile, renewable sources such as solar and wind are proving to be less reliable without more battery storage capacity. The result is oil over $80 / bbl, which wasn’t on any economist’s radar screen, and greater dependence on Saudi Arabia and Russia.
The reality is that we have underinvested in resources, energy and metals for the last several years and it takes years to bring on new supply especially in a highly regulated and environmentally hostile market.
Meanwhile, government stimulus remains at full throttle amid shortages and a record-breaking economic recovery in the second quarter. If economics 101 still applies, too much demand and too little supply gets you higher prices. It’s just an argument over how long. However, with the Fed not giving much credibility to the sustained inflation argument, it may mean a sudden change for monetary policy provided the Federal Reserve doesn’t become too politicized. Easy monetary policy is crucial to the Biden administration and Chairman Powell’s job comes up for renewal in February. I’m sure he aims to please or someone from further left on the ledger will be there to replace him. As one final thought on this issue, history has shown that the easiest way to raise tax revenue to pay for the out sized deficits is through higher inflation. It’s called financial repression.
Federal Reserve
Inflation and full employment are the Federal Reserve’s two mandates with their emphasis on the latter. Inflation is already exceeding their objectives, but employment still lags which is their rational for maintaining such an accommodative monetary policy. However, there are signs of change as the Fed is now openly discussing a reduction of its injection of liquidity through the purchase of $120bn of bonds and mortgages each month, which they refer to as tapering. Current thinking believes this could start as early as November and be completed by mid-next year. This would then be followed by higher interest rates. The timetable has been moved forward by almost a year from what was earlier expected. It would appear that the Fed’s position is compromised in favor of higher interest rates. Either employment picks up and their goals are reached suggesting a more normalized monetary policy or employment doesn’t improve and wage escalation drives further inflation and market forces will take control of the Central Bank’s agenda. Complicating the Fed’s independence is the government’s dependence on additional deficit financing to fund their programs. There are currently two open positions at the Fed and Chairman Powell, who has been labeled a dangerous man by Senator Warren, sees his term up for renewal this coming February. It is hard to believe that he won’t be pressured to remain accommodative.
China
Somewhat extraneous to my message here is what is happening in China. But, it bears watching. The topic is worthy of a fulsome analysis, but let me just touch on what I think is the main principle, which is the current leadership under Xi Jinping undoing Deng’s market reforms and returning to Mao Zendong’s socialist vision. An exaggeration? Well, in July Xi appeared in a Mao suit at a Centenary Celebration and sang a song long symbolizing the declaration of war by the working class on capitalism. In general, the government is cracking down on the private sector and specifically the real estate and technology sectors where a lot of wealth has been made, and celebrities.
The most apparent symptoms of this reform are the recent problems with real estate company Evergrande and the saber rattling over Taiwan. Evergrande is listed in Hong Kong, employs about 200,000 people, and has 800 unfinished residential buildings across China with 1.2 million people having made deposits. However, it is only one of a further twelve real estate companies that have now defaulted on bond payments totaling $3.0bn. Real estate and related industries account for about 20% of the urban workforce and almost 30% of GDP. Although the Chinese leadership is not sympathetic of higher home prices and the wealth that has been created, it will not likely walk away from those who have purchased unfinished units, construction workers, suppliers and small investors.
In reality, Evergrande is too big to fail and will likely either get a Beijing bail out or be restructured. Nonetheless, it is symptomatic of a shift in attitude and likely slower expansion and what that will mean for Global economic growth.
Taiwan is a wild card. Beijing has been making threatening military gestures towards the island which raises tensions with the US. After Biden’s abrupt pull out from Afghanistan many allies question his resolve to live up to treaty obligations. Xi recently said “To achieve the reunification of the motherland by peaceful means is most in line with overall interest of the Chinese nation, including our compatriots in Taiwan. No one should underestimate the Chinese people’s determination and strong ability to defend national sovereignty and territorial integrity. The historical task of a complete reunification of the motherland must be fulfilled and it will definitely be fulfilled”. The 20th National Party Congress meets in November of next year to decide on whether Xi remains in his role. Who knows whether Taiwan will factor into this decision.
Conclusion
As I said, the economy will probably improve as bottlenecks get resolved, inventories are replenished and the Delta variant runs its course. Furthermore, Fed policy is about to shift, but will remain accommodative until tapering is completed, probably next summer. This should cause some further steepening of the yield curve, which combined with further economic strength should favor a value bent to stock selection.
However, as the year progresses I become a little less enthusiastic about the market. Macros shift from supportive to headwinds. Accelerating economic growth and earnings downshift dramatically by the end of next year. We’re also likely to have a less accommodative monetary policy and less government stimulus aggravated by increased government regulation and anti-trust legislation specifically directed at technology and media companies.
Furthermore, a strong economy soaks up liquidity which is principle number one.
Just look at this chart.
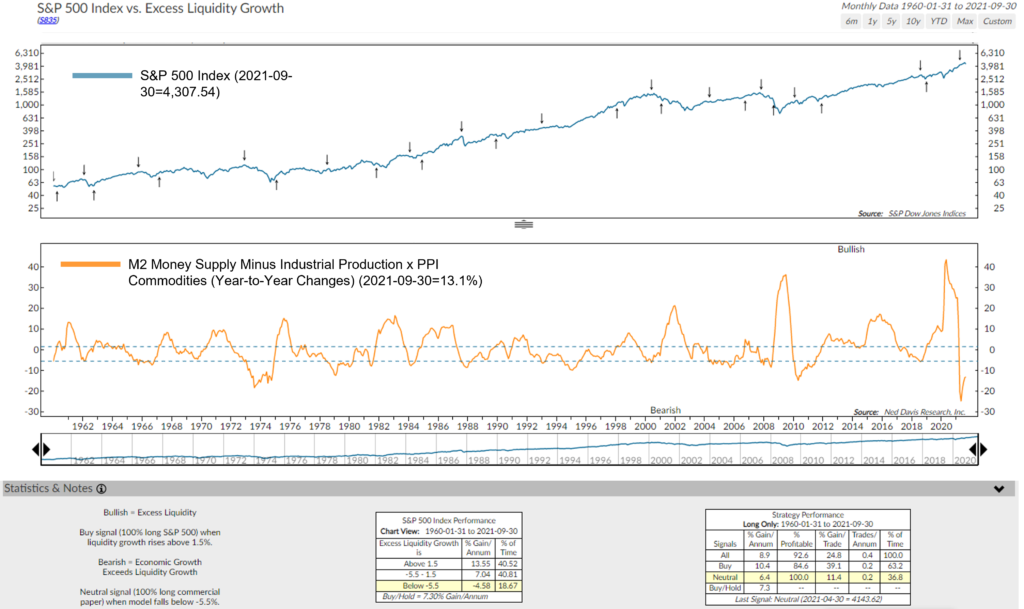
It shows how inflation and economic growth require funding and has already turned negative. Simplistically, Main Street draws money down from Wall Street. Furthermore, we’re likely to have tax increases to factor into our earnings projections and all of this in the context of a stock market that is overvalued by most historical measures. But don’t let this sound too bearish. These are contrasted with unusual strengths. In absolute terms things will still be pretty good.
Nevertheless, traditional, market tops are created by a strong economy that elevates inflation, which the Fed resists by raising interest rates and draining liquidity. A lot of these conditions seem to be falling into place, but time will tell.
Gerald R. Connor
Chairman
Credits:
Yardeni Research
Ned Davis Research
Reuters
John Aitkins
Woody Brock
We All Agree, Up To A Point
Why so much attention on the Federal Reserve and obsession over inflation? Because Central Banks usually end Bull markets and economic expansions when inflation heats up. But, this time it is a little more nuanced than in past cycles. Statements such as, ‘until substantial further progress has been made toward the Committee’s maximum employment and price stability goals’ and ‘Transient’ are open to interpretation.
What we can all agree on is that the economy is recovering thanks to an unprecedented amount of fiscal and monetary stimulation and that the recent spike in inflation and economic growth will recede. So, you can forget about the newspaper headlines and current economic conditions, they’re already baked into equity prices. However, beyond transient there is a wide spectrum of outcomes and possibly a Bear Market lurking.
So, I want to look at where we are today and how the future will contrast to these current conditions and what that might mean for the markets.
Economy
Let’s start with the economy. It’s ripping due to pent up demand and the enormous amount of stimulus that was injected by the government and Federal Reserve. Consensus believes that growth in GDP and earnings will peak in the second quarter. The Atlanta Fed expects growth to be 7.9% but that’s a drop from 13.7% in early May and analysts see earnings expanding by over 60%. But, growth is then expected to decline steadily to 2.4% by the fourth quarter of 2022 as some see a ‘fiscal cliff’ as government stimulus fades. Spending will shift from goods to services and there will be tax increases. The Delta variant could push us back towards shut down and auto and home sales are already declining as some fear that the consumer is tapped out. According to Rosenberg Research, whose advice we listen to, consumers bought more in the way of durable goods in the past fifteen months, 30% growth from pre-pandemic level, than they bought cumulatively in the prior six years. Furthermore, the Citicorp Economic Surprise Index has gone negative, meaning that current economic conditions are not meeting expectations, which is quite a contrast to a couple of months ago. Add to these concerns the recent flare up in the Covid Delta variant and slowing GDP in China. If this retraction is truly due to faltering demand, then the economic expansion scenario is in jeopardy, which is the Bear Market case.
Although I buy the slowdown argument, I’m not convinced that the consumer is tapped out. The regional Federal Reserve boards conduct regular surveys and the most recent one showed unfilled orders at a record high and inventories at a record low. So, the slowdown in sales maybe a reflection of supply shortages, not lack of demand. We also have the propensity to spend showing up in a shift from goods to services. Consumers want to travel, attend entertainment venues and go to restaurants. Furthermore, Europe’s economy is now coming around, so we face the prospect of a global synchronized recovery in the second half.
Supporting this is a record amount of savings, which represents latent spending that I’ll quantify later.
Evidence of this mixed message recently became apparent in the fixed income markets as 10 year Treasury yields dropped from 1.74% to 1.25% seemingly supporting the case for a weaker economy. However, this was not confirmed by the spreads between corporate and government yields, which invariably increase during economic slowdowns.
Inflation
Obviously, everyone favors a strong economy, but they don’t want the inflation baggage that usually accompanies it. Here again we have the transient argument. Most of it is supported by the short-term economic strength factors that most see waning. But the Fed adds other things to this list, such as base effect. This is the difference in prices today compared to the depressed prices during the Covid lockdown. It is accentuated by supply shortages and one time stimulus cheques being spent. Their belief is that the secular forces that have held inflation down such as globalization and technology driven productivity will reassert themselves, and that’s probably true, but there are some big hurdles to overcome.
Let’s start with housing. It is one third of the consumer price index (CPI). It is calculated by imputing what it would cost a home owner to rent his own home, or Home Owners’ Equivalent Rent (HOER). It was up only 2% over the last year but home prices have increased by over 18% in that period and there is usually about a one year lag between home prices and HOER. In 1995, the last time core CPI was above 3%, HOER was 3.5%. Furthermore some of the house price inflation is due to low interest rates, so it draws into question why the Fed is still buying $40bn of mortgage- backed securities each month.
Wages are another factor in the inflation puzzle. The transition crowd says productivity will be enough to offset wage increases and the government says there are still 7.6 million fewer employed than before the pandemic, so we have a surplus. Yet a recent government jobs report known as the JOLTS survey showed 9.21 mn job openings, a record high. Almost equal to the number of people unemployed. So why hasn’t employment improved more? Well, there are a number of reasons. First, many think that people are staying home because the unemployment benefits are higher than what they can earn. Already, 22 states have eliminated a $300 per week entitlement to encourage people back into the workforce. Otherwise, we’ll have to wait until September when the government benefits end for about 3.6 million people to test this theory. If people do return to the workforce, it suggests that the transient economic growth may transition to something hotter than expected. There are others that are staying home, especially women, because they can’t find day care for their children or because schools aren’t open. This too should get resolved in September. One would assume that this could ease wage pressure. However, the fastest wage growth has been in leisure and hospitality, the lowest paying industries and difficult to automate. As an example, Domino’s Pizza is offering some delivery drivers $1000 signing bonuses and $25/hr. There are also significant mismatches by skills, industry and location suggesting continued labor shortages.
The average hourly earnings (AHE) of lower-wage production and nonsupervisory workers (81% of payroll employment) rose 9.3% over the past 24 months through May. That’s twice as fast as the 4.8% increase in AHE for high-wage workers. Prior to the pandemic, AHE was rising 3%. Although forecasts for wages are thought not to be an issue, the Biden government and the Fed are focused on equality and how labor’s share in corporate profits has declined. To accomplish this you need higher wages and some of this will either get passed-on in price increases or you will see a decline in profit margins. Bottom line, the working age population, excluding those over 65, is declining. Baby-boomers on the verge of retirement still account for 6.5% of the workforce. Furthermore, as they age, they create caregiver jobs that can’t be automated or shipped offshore. You also have people that had jobs in leisure, entertainment and hospitality that are committed to career changes to jobs that are more sustainable and less subject to layoffs. This aggravates the jobs/skills mismatch.
So, I don’t disagree that transitional inflation will recede but with wage and housing cost pressure likely to pick up and last longer, the base rate of inflation may be higher than expected. If it isn’t dealt with, it will work its way into expectations and tolerance for further price increases as seen in a Conference Board survey in June where inflation expectations for the next twelve months jumped to 6.7%. Obviously, this debate over the statistics won’t be known until they are published. That won’t do us much good as the market will have already reacted. So, to help anticipate whether inflation is going to be problematic or transient, one has to rely on some economic theory and a lot of it is getting discredited. It’s the basis for my conclusions. But if you’d rather forego revisiting some of your college economics, please feel free to skip ahead.
Economic Theory
The ‘Quantity Theory of Money’ was originally set forth by Irving Fisher nearly a century ago and reborn in the ‘60s by Milton Freedman. It is the basis for traditional economic thinking that equates stimulative monetary policy with inflation. Those educated in this thinking have been waiting for a bout of inflation since the first rounds of Quantitative Easing (QE) were introduced during the Financial Crisis in 2008. Because it didn’t happen, many think the theory is no longer valid along with the Phillips Curve that equates labor shortages with rising wages.
However, there is an explanation. Central Banks execute monetary policy through the commercial banks. They do this by buying bonds from the banks which creates free reserves. The banks can then make loans up to ten times the amount of free reserves. However, in the aftermath of the financial crisis, those free reserves simply replaced about $4tn of problem bank loans, and in fact, were not lent out as they soared from roughly $50 bn to $4.5 tn. Therefore, monetary policy was short circuited and there was no impact on Main Street. This time, in the aftermath of the Pandemic Crisis, the Central Banks again engaged in QE but instead funded government treasury issues that were given directly to citizens in wage and other subsidies, thus bypassing the traditional commercial banking methodology. As we have seen, it worked and spending on consumer goods has increased dramatically, not only stimulating the economy but also causing inflation. So, the theory seems to be working and the only debate is whether it can be sustained. However, this hasn’t been a perfect pass through. There has been a short circuit in the form of savings. Total deposits at commercial banks rose $3.5 tn since March, 2020 to $17.1 tn. Furthermore, debt to disposable income has dropped to 85.5% in Q1, the lowest since 1995. So the consumer has firepower almost equal to the size of the economy. Of course, not all of it will get spent as lower income earners will be more likely to consume than higher ones.
This latent spending power is likely to sustain a higher consumption level beyond the actual disbursements by the government and argues for a stronger economy.
Another thought I’d like to introduce relates to the definition of inflation. For official purposes, we only include certain items, those that affect our cost of living but not those that support it like financial assets. This is the divide between Wall Street and Main Street. All the financial stimulation that we have seen since 2008 has had a major inflationary impact on financial assets and real estate, and has contributed to the financial social divide that we face today. Although the politicians would like to blame it on the capitalists, they are fully complicit in providing the wherewithal for the gap to be created through their own misunderstanding and lack of proper inflationary accounting.
Deutsche Bank published a very good piece on some of the softer aspects that will influence inflation that I would like to paraphrase.
The philosophical shift in government thinking from the fear of inflation and the rising levels of government debt, which shaped generations of policymakers, is now being replaced by the belief that economic policy should now concentrate on broad social goals.
Concerns over high and rising levels of sovereign debt are being relaxed as inflation has remained contained despite low interest rates. Concerns over debt sustainability and inflation have diminished as politicians believe structural forces will continue to suppress prices.
Policy has moved beyond just stabilizing output across the business cycle.
Fiscal stimulus is off the charts while Central Banks have shifted to having a tolerance for high inflation. Price growth could regain significant momentum as the economy overheats in 2022. The sum of the stimulus so far is in excess of $5tn or more than 25% of GDP not including the proposed legislation and deficits that are likely to come in at around $3tn.
Today’s stimulus dwarfs that seen in 2008 and the early 1930’s. Around WWII, deficits remained between 15%-30% for four years and inflation was 8.4%/14.6%/7.7% in ‘46/‘47/’48, respectively.
The Fed’s balance sheet has almost doubled during the Pandemic to nearly $8tn. Compared to the 2008 Crisis when it increased a little over $1tn and then another $2tn over the next six years.
The Fiscal Deficit and Fed balance sheet expansion combined equal approximately 30% of GDP in 2020 and will remain around 20% in 2021. This kind of explosive spike in monetary policy has, for the last 200 years, coincided with a similar spike in nominal GDP. This coordinated monetary and fiscal response has practically no parallel in US history.
Another difference between today and 2008 is that real disposable income has hit an all-time high in the US despite a recession. Consequently, excess savings has reached $2tn or more than 10% of GDP. Assuming 25% of these savings are spent over the next 18 months plus the stimulus from Biden’s Jobs and Families Plan will be enough to push GDP to more than 5% above potential by the later part of 2022. Overheated economies are typically quickly followed by a sharp run up in inflation.
Furthermore, there is political pressure on the Fed to err in the direction of delaying policy tightening, especially while the Fed leadership is up for renewal next year. Today, inflation is much less important than in the Reagan/Volcker era. Today, the focus is on not only employment but also on greater equality in income and wealth.
Monetary policy operates with long and variable lags. So, if inflation overshoots excessively and persistently, what will the Fed do? It will be forced to act, which will likely be highly disruptive to the markets and economy.
The perception that is being engrained is that high levels of debt and high inflation are a small price to pay for achieving progressive political, economic and social goals. This will make it difficult to accept higher unemployment in the interest of fighting inflation.
Federal Reserve
Now let’s talk about the Fed. We know that at some point, they are going to do two things. First, they will ‘taper’ which means, buy fewer bonds and mortgage-backed securities each month until they don’t buy any. Then they will start to raise interest rates to ‘normalize’ policy. This has a number of consequences for the stock market. Initially, Fed tightening can cause a correction but doesn’t historically end a Bull market. Second, it can change the complexion of which industries perform better, and influences the growth/value strategy. And finally, too much tightening can end the market’s and economy’s advance? So, every Fed meeting and economic release is dissected for some nuance on the Fed’s next move. Chairman Powell has repeatedly said that they will not raise rates ‘until substantial further progress has been made toward the committee’s maximum employment and price stability goals’. So what does that mean? They’ve said they’re willing to let inflation overshoot for a while to get to a socially-adjusted, fuller employment. If we use that as a benchmark and we take the average increase in employment, 468k new jobs per month which was the average in Q2, then it will take until mid-2022 to reach their goal of pre-pandemic employment.
And how long is Transient? Are we talking about fiscal stimulation? If so, and it’s been a one shot, demand-boosting policy, then shouldn’t the US budget deficit recede back to normal? According to Rosenberg Research, when examining prior spikes in inflation and the Fed’s reaction, this suggests that it could take 14 to 22 months before they react.
And what is tolerable ‘inflation overshoot’? Here the Fed talks about symmetry. Well, inflation averaged 1.6% since 2011 and only 1.2% in 2020. So, you need 2.4% average inflation through the end of the decade until 2030, with occasional peaks of 3% or more.
The Fed has also said that it will wait for actual evidence of inflation or other imbalances. This is also quite a departure from past protocol where the Fed has anticipated economic conditions using its many forecasts. After all, monetary policy is a leading indicator and now, it will be used in reaction to a coincident indicator. Consequently, there is a risk that if inflation is more than transient, the Fed will be well behind the curve, which will require a greater than otherwise required reaction to get inflation in check. Can this even be contemplated in an over-leveraged world? If not, what is the antidote for inflation?
Regardless, the mid-June Federal Reserve meeting was a bit of a reality check. Their message wasn’t much different, but they did open the discussion on when they would start to taper. The first sign of monetary tightening. Otherwise, the focus was on what is referred to as the ‘dot plot’. This is a record of when each Fed governor feels interest rates should be adjusted. Until June, the belief was that rates would hold until 2023. But this meeting saw 7 FOMC participants anticipate at least one rate hike next year up from 4 in the previous meeting and of those seeing an increase, two thought there would be two rate hikes. So, what happened to waiting for maximum employment, actual evidence and patience with inflation overshoot? Sounds like someone is looking at economic theory, which is why I elaborated on it earlier, as their inflation expectations rose from 2.4% to 3.4%. The reaction in the bond market was immediate as the curve flattened. Two year yields rose and ten year yields dropped. The reason: tapering means fewer Fed purchases of shorter-duration bonds, which is what they hold. That puts upward yield pressure on the two year Treasury note. However, willingness to raise rates sooner shows an inclination to fight inflation and puts downward pressure on the ten year yield.
The stock market took its lead from the bond market where the ten year yields had already dropped from 1.79% in March to 1.25% by July 9th. As longer rates dropped, signaling lower GDP growth, the growth stocks outperformed value. Some extrapolated this as a sign of weakening economic growth. However, the yield spreads between government and corporate yields would have widened if that had been the case and they did not. Yet, the Fed has not implemented any changes, which suggests that the decline in the ten year yields could be due to technical factors. In the past twelve months, the Fed has purchased $1,395bn of securities and has flooded the banking system with deposits while loans have been weak. This has resulted in the banks also being big buyers of treasuries, $867bn, to invest the surplus funds which drives rates lower. Combined, they have purchased $2.26tn in securities. Basically, government deficits are showing up in savings accounts and paid down loans.
The real question is why the Fed is still buying $120bn of securities each month when the economy is at a new record high and inflation is above their 2% target? On balance, the Fed’s mid-June statement suggested that there was a greater propensity to fight inflation than what there had been earlier.
Regardless, there seems to be an intractable course towards higher interest rates. If the economy continues to grow and inflation remains hot, the Fed may be pushed to react sooner than they have indicated. This would be especially true if the termination of unemployment benefits and the return to school in September drive the unemployed back into the workplace. But even if things cool off, the Fed has indicated a desire to normalize monetary policy. Only an unexpected slowing in economic growth could trigger a reappraisal and with so much consumption firepower sitting in bank savings accounts, that’s a hard case to make.
Stock Market
So, what does this mean for the stock market? Obviously, the focus is on the Federal Reserve and how and when they will start to tighten monetary policy. However, an increase in interest rates is only the beginning of the end and in the current conditions, maybe the beginning will be signaled when the Fed starts to taper its bond buying. This usually gives the market a shake but doesn’t terminate the advance. However, below the surface of the general market’s trend there is a lot happening that will determine performance.
Active management has had several themes to play over the last fifteen months starting with the Covid pandemic benefactors such as Amazon and Zoom. Then there were the ‘stay at home’ stocks like Netflix and Home Depot. This was followed by the recovery names such as the autos, industrials and home builders. The next phase was performance by the ‘coming out’ companies which included restaurants and airlines followed by a recent sell off in value and rotation to growth as the 2-10 year treasury yield spread narrowing surprised the market and concerns over the Delta Covid variant increased.
This growth/value backdrop has been a pervasive theme for the market through this whole period as falling rates in reaction to the pandemic supported growth. But, starting in November of last year the investment landscape changed as the anticipated Democratic victory brought forecasts of larger government deficits and a stronger economy which drove interest rates higher. Value, being more economically sensitive took the market leadership and has maintained that advantage until this June when treasury yields continued to drop from their March peak of 1.74% to a low of 1.25%. Since that peak in rates, the market has essentially flat-lined while growth has recently regained its leadership. During this period, growth is up 4.4% while value has slipped -0.8%. However, year to date through May, value still prevailed at +16.6% vs +7.8%.
In the second half, I would expect the themes to continue to rotate, but I would also expect the general market environment to be a little less friendly. In the second quarter, things were as good as they are going to get. Earnings and economic growth peaked along with government stimulation. The market will focus on what we refer to as the second derivative, which is the growth rate from one quarter to the next. So, earnings may be up 60% in Q2 but are projected to be up only 23% in Q3 and 17% in Q4. A declining rate of change, but still quite strong by historical standards. Nonetheless, the growth rate is slowing. Furthermore, a strong economy will require funding at potentially the same time as the Fed starts to contract liquidity. Financial instruments are generally the source of those funds which withdraws support for the market. Finally, the threat of tax rate increases next year could threaten significant fiscal drag as government spending proposals get watered down which would again be quite a contrast to the first half of this year. Historically, we’re following a fairly traditional pattern where monetary and fiscal policy are quite stimulative in the first year of a Presidency and then fall going into the second year, which is consistent with a market correction.
This combination of stretched valuations, peak economic growth, declining commodity prices and a Fed on the verge of becoming more restrictive provides an interesting but negative contrast to what we saw in the first half of this year.
Conclusion
As the title of my commentary states, I agree with the consensus view, but only up to a point. The economy, inflation and earnings growth are as good as they are going to get and will diminish or transcend in Fed speak. But, I don’t think we’re going to regress back to pre-Covid levels and that the residual economic strength will result in an inflation level above the Fed’s expectations. Will the Central Bankers react to this or will they be compromised by political influence? I don’t know. Furthermore, given the enormous amount of corporate and sovereign debt outstanding, can the Fed even use traditional interest rate increases as an antidote for inflation? If not, it will fuel a secular shift in investments to an inflation hedge type of strategy. For sure, any attempt to stem inflation with monetary policy will be met with a negative reaction by the financial markets, which has normally caused the policymakers to back off and certainly today’s collection of politicians and bankers stands in contrast to the Reagan/Volcker era which was prepared to do what was necessary to preserve some fiscal and monetary responsibility. The current Fed is not a guardian against inflation, but instead a proponent of it. ‘Group think’, low interest rates, debt monetization and massive borrowings not resulting in inflation has resulted in a re-appraisal of traditional economics. Structural forces are seen to replace traditional paradigms, and this has allowed monetary policy to go beyond stabilizing the business cycle to underwriting political social agendas under the excuse of a pandemic.
Although I do expect the market to work its way higher, I think investors are going to have to be a little more astute as to what they invest in. I don’t think the general market averages will provide a rising tide to make index investing attractive. But, I do believe equities, even with a market correction, which is overdue, will be the best asset class to protect your wealth.
Gerald R. Connor
Chairman
Credits
Grant’s Interest rate Observer
Deutsche Bank Research
Apline Macro
Rosenberg Research
Yardeni Research
Ned davis Research
John Aitkens
J.P Morgan
Barrons
Don’t Worry. Be Happy
This time last year we were in a pretty dark place. The economy was being shut down, COVID-19 was out of control and the stock market was crashing. The worst was feared and the only glimmer of hope was a government recovery bill for an astronomical $1.9 trillion that had just been passed by Congress. We’d seen recessions before, but nothing like this one.
Yet, here we are today. The markets are at all time new highs. The economy has almost fully recovered in GDP. There is still unemployment, but it is improving, and COVID is still around but on the decline, unless you live in Canada.
I can’t help but believe we are witnessing financial history in the making. Winston Churchill is credited with saying, “Never let a good crisis go to waste”, and all the politicians on both sides of the border are fully embracing this.
Monetary policy, social reform, the environment and more are all being swept along on this ride to respond to a virus.
The immediate consequences of all this feels pretty good right now. The stock market is up, the economy is recovering, spring is here and the vaccine, at least in the US, will have us back to normal by summer. This cocktail of one part vaccine and two parts stimulative monetary policy and fiscal spending could lead to a party that gets out of control.
So, let’s delve into some of this and I’ll try to make the boring stuff, like the economy, either interesting or short. I’ll start with the Federal Reserve’s monetary policy and free money before getting into the stock market.
Federal Reserve
The Federal Reserve is in the lead on rewriting conventional policy. Historically, the Fed worked through the commercial banks to affect monetary policy. When they decided to stimulate the economy they would traditionally buy government bonds from the banks, which would create free reserves. Free reserves could be leveraged by the banks. They were allowed to lend $10 for every $1 of reserves. So, bank lending would rise. Consumers could buy a car, a house or run up the balance on their credit cards. Corporations could borrow to build a new plant or buy a piece of new equipment. It worked.
But, after the 2009 recession, the Fed initiated Quantitative Easing. They bought trillions of dollars of bonds from the banks, but lending didn’t pick up. The banks kept the money to replace bad loans and investments. So the economic recovery, after the Financial Crisis, was weak. During the Covid crisis, the government has apparently decided not to leave something as important as the economy to the banks. They decided they would get the money directly into the economy by either increasing their spending or by sending checks directly to their citizens. Ben Bernanke, a former Fed Chairman, referred to this as helicopter money. The government does this by borrowing the money and the Federal Reserve gives them the money but by buying those bonds. We’ve never seen this before and academics refer to it as Modern Monetary Theory. So far, this experiment is into the trillions of dollars without any true understanding as to how the deficits ever get resolved. But for sure, it accomplishes a couple of things. It gets the government directly involved in the economy deciding who should get the money and how much instead of the commercial system. It also means the government doesn’t want to see interest rates go up when it owes so much money. As Lloyd Blankfein, former head of Goldman Sachs, says, “A commodity, including cash, won’t be allocated efficiently if it is free. You need some kind of scarcity.”
So, the two players in this event are the Federal Government and the Federal Reserve. It’s worth reviewing what they have done before getting into the results.
US Federal Government
The first major COVID response was last March with the CARES Act. It totalled $1.9 trillion and sent $1,200 to each citizen, which amounted to $275 bn and raised unemployment benefits to $551 bn. For perspective, the Labor Department estimates that unemployment benefits and personal income amounted to $550.2 bn last year compared to $27.7 bn in 2019. In January of this year, an additional $600 per person in stimulus cheques were mailed. These first two rounds totalled $438bn.
Recently, President Biden got the American Rescue Plan Act, ARPA, approved for another $1.9 trillion. It provides for an additional payment to 287 million Americans (80% of the population) of $1400 totaling $402bn.
These three payments amount to $11,400 for a married couple with two kids. Furthermore, the Wall Street Journal estimates that under this new bill that same unemployed couple would be eligible for $135,000 in unemployment benefits if they lived in Kansas and $170,000 should they live in Massachusetts.
The Biden plan also extended unemployment benefits from March 14th to August 26th. We’ll come back to why this is important later.
So far, it is estimated that the total cost of the COVID relief bills is $5.3 trillion.
But the stimulus doesn’t end here. The stimulus packages that have been approved get spent almost immediately, however there are other programs on the docket which are large but spread the stimulus out over several years. The most recent proposal is the America’s Jobs Plan. It is represented as an infrastructure bill. It asks for $2.3 trillion, would be spent over eight years and paid for by tax increases over fifteen years. This is under debate in Congress. But, it doesn’t stop here. There is a second round of spending expected that will also be in the trillions under the guise of Build Back America Better and focus on “social infrastructure “ which would expand health care, paid-leave and extended child care.
In the context of never letting a good crisis go to waste, I’ll quote Treasury Secretary Yellen’s statement in her Senate appointment hearing, “Indeed, the reason I went from academia to government is because I believe economic policy can be a potent tool to improve society. We can, and should, use it to address inequality, racism and climate change.”
So, these enormous spending bills that are being ushered through Congress aren’t just about transitioning the economy through the Covid Crisis, this is also about social change. There is nothing wrong with that, so long as a government has a mandate. But to push it through under the cover of a pandemic response without knowing how the financial issues will be resolved is worrying.
Federal Reserve
The other half of this duo is Fed Chairman Powell. Where does he stand? On unemployment he stated “This means that we will not tighten monetary policy solely in response to a strong labor market. In particular, we expect that it will be appropriate to maintain the current accommodative target range of the Federal funds rate until labor market conditions have reached levels consistent with maximum employment and inflation has risen to 2% and is tracking to moderately exceed 2% for some time. In other words, “Don’t worry, be happy.”
And, don’t worry about missing out in Canada. Last year’s budget deficit is expected to be as high as $354 bn. For comparison to the US multiply everything by ten. Finance Minister Freeland, like Ms. Yellen, stated that the pandemic has created a window of opportunity for a national childcare plan and a shift towards a more sustainable economy. A green and innovative recovery plan. The government’s new budget is expected to project a deficit of around $155bn in order to get the economy back on its feet. However, of the three million people that lost their jobs to the pandemic it is now estimated that only 296 thousand remain unemployed and the economy has expanded for nine straight months.
So, what has all this stimulus resulted in?
Well, the economy is ripping.
So, what has all this stimulus resulted in? Well, the economy is ripping. The Fed has recently raised this year’s economic guidance and now expects the GDP to rise by 6.5%. That’s up from an earlier estimate of 4.2%. And, they see further growth of 3.3% in 2022. Yet, private forecasters such as Morgan Stanley think the economy show even greater strength and could improve by 8.1%.
Furthermore, the Fed sees unemployment dropping to 4.5% by year end and improving further to 3.9% next year. Inflation is seen rising to 2.4%. Yet, the Federal Reserve Open Market Committee which sets interest rates doesn’t see an increase until 2024.
So, why is the economy so strong when you still have so many unemployed? A lot of it has to do with government policy. When they shut the economy down last spring they also sent people a lot of money. Some of it went into savings, but some of it got spent on stay at home type goods, not services like restaurants because they were shut down. This was a classic manufacturing recovery. Stores like auto show rooms ran out of merchandise so manufacturing was ramped up to not only meet the consumer demand, but to also rebuild inventory levels. This is generally what happens coming out of a recession and why the Purchasing Manufactures Index (PMI) expands rapidly until the inventories get rebuilt and then slows to the sell-through level. When these numbers are released, there are a number of other facts that are released as part of the survey, which gives us better colour on what is going on.
The release of the March PMI showed the index had risen to 64.7, the highest reading since Dec. 1983. Non mfg PMI (ie services) rose to 63.7, its highest reading since July 1997. The prices index rose to 74, the highest since July, 2008. The Fed Philly Region’s survey provides a little more colour. It suggests that business conditions are at their highest level since April, 1973. New orders have also surged at the fastest pace since 1973 while the work week lengthened at a record pace. Manufacturers also reported a backup in UN-filled orders, slower inventory builds by their customers and more delays in supplier deliveries. The future employment index posted its highest level since October 1976, while 64% of firms reported labor shortages and 59% reported jobs/skills mismatches. They further reported input price pressers surged at the fastest pace since March, 1980, partially due to higher wages and they anticipate being able to pass higher costs on to their customers. However, seemingly inconsistent with these reports has been an increase in initial jobless claims. In total, there were still more than 18 million claiming State or Federal unemployment benefits. Yet, total job openings rose to 7.37 million, the highest since January, 2019 and the ratio of unemployment to openings declined to 1.35, the lowest level since last March when unemployment was 4.4% vs 6% today. Overall, 42% of independent businesses had openings while 19% of small business owners plan to raise worker compensation over the next three months. Furthermore, the number of commodities that rose in price or were in short supply hit record levels last month. These conditions are usually associated with an impending inflation.
For perspective, let’s look at where we have come from. Last spring payroll employment dropped by 22.4 million people. Eight million dropped out of the labor force leaving 17.4 unemployed. GDP dropped 19.2% in the first half of last year then soared at an 18% rate in the second half. Employment is still 8.4 million below its record 152.5 million in February last year.
Is there some reason for the disconnect between the demand for employees and their reluctance to return to work?
So, the point I’m trying to make is that there is some reason for the disconnect between the demand for employees and their reluctance to return to work. For sure, some of it could be due to a member of the family having to stay at home to take care of children. It’s estimated this could be five million people. But substantial unemployment benefits could also be causing people to stay home to collect these payments. $140,000 in Kansas for a couple probably goes along way and now that summer is almost here and benefits last until September, there is probably no hurry to get a job.
The picture this paints is a strong economy that has yet to see the services side engage, but which will as vaccines roll out. Stresses in manufacturing from supply shortages, rising commodity prices and labor shortages are likely to result in higher prices and inflation, which could be the most critical variable affecting interest rates and the market. From the Fed’s perspective, they feel that inflation in the near term will be higher due to the “base effect”. This is the year over year difference between last year’s depressed prices and where they are today. Furthermore, they have already conceded to inflation reaching 2.4% this year and have said they wouldn’t mind seeing a period of overshoot before getting concerned. Others believe that secular forces such as technology, globalization, demographics and excessive levels of debt will contain inflation in the long term. Maybe so, but I have my doubts. Outsourcing manufacturing jobs to China may be last decade’s theme. Going forward, a lot of jobs will be created in healthcare, especially caring for the elderly at home. It’s hard to outsource that. Also, the Financial Crisis of 2009 threw thousands of homes on the market at depressed prices. Housing prices are, dare I say, going through the roof and will eventually back into home owner’s equivalent rent, which is one third of the consumer price index. Furthermore, the Producer Price Index, which reflects a lot of commodity prices, showed the highest annual gain in nine and a half years in March. It takes a long time to build a new copper mine or steel mill. And although people may start coming back into the workforce this fall, the hourly compensation for all workers is already rising at 5.3%.
But supply and demand will also play a role in determining interest rates. Debt, which the government is relying on to stimulate the economy and accomplish its social goals is beyond anything that I have ever witnessed. The sum of all government and corporate debt is now about 2X GDP. Bonds issued by non-financial corporations rose from $355 bn in 1980 to $6.38 trillion in 2020. Year to date, the US Treasury has issued $4.1 trillion in debt, up 50% from a year ago, while globally the supply of new government debt has risen 78%. One has to ask, how does the government ever get off this treadmill without the economy falling off a fiscal cliff? Modern Monetary Theorists say don’t worry, the Fed will keep buying. But the caveats is that there would be a reaction if inflation heats up. Taxes would have to be raised. Unfortunately, I don’t see how raising taxes helps an economy.
On the supply side, personal savings rates are the highest since the mid 1940’s. Last April savings soared to $6.4 trillion on the CARES Act distributions before falling back to $2.3 trillion in December as people were able to get out and spend. This January saw savings climb $1.6 trillion to $3.9 trillion on the distribution of the social benefits from the second stimulus bill. That leaves us with about $2.4 trillion in excess savings over base line which amounts to about 11% of GDP. Furthermore, revolving credit dropped $118bn adding even more firepower to the consumer’s war chest. Maybe an even better way to look at it is through M2 which is the aggregate of all savings, currency, money market funds, etc., which rose 27.1% year-over-year to $4.2 trillion an unprecedented level.
Deposits at commercial banks that include corporations rose $2.9 trillion last year causing banks to buy $758 bn in Treasuries bringing their total to $4.8 trillion. Along with the Federal Reserve, this has helped finance the government’s deficit. The trouble with this is that consumer savings short circuit the government’s stimulus objectives just as the banks did after the Financial Crisis by not sending and getting the funding into the economy. With the vaccine being rolled out, services like travel and entertainment coming back and summer weather arriving, it is likely consumers will start to spend more aggressively and add to what is an already robust economy.
The Stock Market
So, where does this leave our investment strategy? Well, the first quarter treated us very well and was a nice follow up to a strong year-end finish. In Canadian dollars, the S&P 500 finished +4.9%, while the TSX improved 8.1% and the Canadian bond market declined -5.04%. However, below the surface there was a lot going on. Value outperformed growth which can be measured in a number of ways. Using the S&P indices value outperformed growth 10.664% to 0.746%. The NASDAQ, home to a number of technology companies saw over a 10% decline from its mid-February peak. And, as I said, the first quarter was a follow-through to a trend that started September 1st, last year, which has seen the value companies appreciate 18.5% while growth marked time up only 1.9%. There are a number of explanations for this divergence, but the one that probably has the best correlation and fundamental rationale is interest rates.
As measured by the 10 year US Treasury, rates bottomed at 0.54% last August and increased to 0.93% by the year end. They then moved significantly higher to 1.74% by March 31st. This increase in rates reflects both the strength of the economy and the perception that inflation could heat up. Fundamentally, it will help the bank stocks as higher rates will help their earnings and financials are the poster child for value. If higher rates correlate to higher inflation and a stronger economy, that means good things for commodity producers and economically sensitive companies which again are generally value stocks. To the contrary, higher interest rates tend to hurt growth stocks and any long dated assets such as bonds. It doesn’t effect growth company earnings, but it does hurt their valuations as most carry high price earnings valuations. These valuations are determined through discounted cash flow models and the higher the discount rate, the lower the valuation. Goldman Sachs did a study that equates a 100bps rise in rates to a 14% impact on DCF models. In fact, the 70bps rise in rates we witnessed this year seems to correlate well with the 11% drop in the NASDAQ Composite that we saw from February 12th to March 8th. This also explains why the bond market experienced its worst quarterly performance since 1976 as the 30 year Treasury fell 15.66%.
The question we now face is whether this value versus growth competition is about to flip back in favour of growth. It could, but from our view on the economy and inflation it seems like interest rates will continue to support value. As we stated above, the economy is quite strong, about to get another jolt of fiscal stimulus and will see vaccine relief open up the service sector. Inflation should heat up even if only transitionally as workers wait for benefits to run out creating a labor shortage until at least this fall. Finally, the government is going to continue to float more bond issues, but will need even greater reliance on the Fed if banks start to sell their treasuries to make loans.
Furthermore, growth hasn’t had any kind of a setback, so it is still expensive. The elite eight which includes the FANG stocks still trade at 40X earnings. For context, the S&P 500 trades at an elevated 22X forward earnings. That is expensive and one has to hope this is resolved through continued earnings growth which is what is now expected. But that growth is likely to come from the more economically sensitive companies. Value on the other hand has outperformed for only seven months after underperforming for thirteen and a half years, the longest stretch on record. Previous underperformance was during the tech bubble from 1998 to 2000 and before that, the second longest underperformance was the biotech bubble in the early 1990’s that lasted 3.8 years. And finally, there was the devastating period for value in the early ‘70’s when the “Nifty Fifty” took charge. So, I’d give value the benefit of the doubt right now.
As for the market generally, we might start looking out for a correction. Working against this caution is the enormous amount of liquidity that could come into the market. Some of the money from President Biden’s latest bill will find its way into the equities. But as we proceed through the summer and the economy picks up further, liquidity will have to come from somewhere if there are no more cheques from the government. Historically, it comes from financial assets. Furthermore, as you get closer to 2022, the prospects aren’t as compelling as they are now. You’re likely going to be looking at tax increases. They are already built into corporate earnings forecasts of roughly $20.00 per share but I’m not sure there are not more on the way. The economy could overheat and inflation could move higher than the Fed antipicates, and I would expect Powell to do an about-face as he did in January, 2019 when his rising interest rate policy caused a dramatic stock market sell off. His last two policy changes have been market driven and a bad reaction in the bond market to higher inflation would force him to act.
You will also have the prospects of the current government losing some seats in Congress which traditionally happens in off-year elections. You could then return to a more divided agenda and less likely stimulation.
So, we’ll stay with a value bias and remain somewhat cautious as we move through the summer.
Credits:
Ned Davis
Grant’s Interest Rate Observer
Yardeni Research
John Aitkins
Wall Street Journal
November: Record Gains and Relief From Worst Case Fears
November’s stock market gains will go down as some of the best on record. These were driven by earnings growth as well as three pieces of news that were a relief from worst case fears. First was the Biden win without giving control of the Senate to the Democrats, second was the Pfizer vaccine announcement and last was Biden’s telegraphed appointment of Janet Yellen as the next Secretary of the Treasury.
Here are some thoughts on the market, the election, the economy and the Federal Reserve.
Market: New names lead the gains
The S&P 500 gained 10.8% (7.74% Cdn) in November, while the Dow Jones did 1% better. That’s the strongest monthly gain since January 1987.
Interestingly, value stocks outperformed growth stocks by roughly 45% with energy, financials, industrials and materials doing better than the technology, internet companies and stay-at-home stocks that had been leading the market.
Smaller companies significantly outperformed bigger ones, and businesses like airlines, hotels, resorts and cruise lines surged on the prospect of a vaccine.
A critical issue is whether value-oriented stocks will maintain their leadership or whether leadership will revert back to a small group of technology companies. The test is likely to come after a small correction, when we see which group leads the next rally.
With 86% of companies trading above their 200-day moving average and bullish sentiment at 60%, short-term caution is warranted. Nevertheless, there is a lot of money still available to enter the market, as cash and other liquid assets have shot up $2.6 trillion to $16.3 trillion.
U.S. Election: Big changes off the table
The Biden win without a blue wave allowing the Democrats to take over the Senate is probably more about what won’t happen than what the new administration will propose. Off the table are higher taxes, massive federal spending, universal basic income, nationalized healthcare, a packed Supreme Court and a Green New Deal.
However, there is a runoff election this January for two Senate seats for Georgia. The Republicans lead in the polls, but it is worth anticipating what happens should the Democrats win those seats and the Senate becomes tied at 50 members each.
Kamala Harris as Vice President presides over the Senate and would then have a tie-breaking vote. In this scenario, Republicans would lose their committee chairmanships and their ability to serve as a check and balance to Biden’s plans.
If the Democrats get organized, what has come off the table would suddenly be back on again. However, the Democrats aren’t unified. For example, Joe Manchin, a Senator from West Virginia, is an avowed conservative who recently said, ”I want to rest those fears for you right now… whether it be packing the courts or ending the filibuster, I will not vote to do that.” He further stated that the “Green New Deal and all this socialism was not who we are as a Democratic Party.”
Nonetheless, as Yogi Berra once said, it ain’t over until it’s over.
Economy: Strong expansion but soft patch ahead
Third quarter GDP came in at +33.1% and the fourth quarter is expected to be around +11%. Nonetheless, the market is caught in a conflict. For the next six months, the Corona virus count could continue to climb, threatening the near-term expansion until a vaccine finally rids us of the pandemic and we can get back to normal.
Back in March, the passing of the CARES Act provided Americans with a one-time payment of $1,200 and an additional $600/mo through August. In all, the government provided $842 billion in new benefits while the earnings shortfall amounted to $444 billion, resulting in $398 billion in extra stimulus. It’s the first recession where personal income actually increased.
Not all of this income was spent right away. April savings hit $400 billion, well above the $103 billion baseline as stores were closed. This pushed the amount of cash on household balance sheets over $2.0 trillion. More recent spending on goods has benefited from pent-up demand, while spending on services remained restricted. For manufacturing, this spending arrived as inventories were depleted.
Today, savings are being drawn down and CARES ACT benefits will run out for about five million people at year end. With COVID cases spiking, we’ll have to wait and see if the economy can skate through this soft patch.
Nonetheless, a vaccine and better weather in the spring provide a lot of hope.
Federal Reserve: A familiar name with untested ideas
One of the recent announcements that encouraged the market was Biden’s telegraphed nomination of past Fed Chair, Janet Yellen, as Secretary of the Treasury.
First, it eliminated a more threatening option such as Elizabeth Warren, and was a more moderate choice than what many progressives in the party had hoped for. The selection immediately sent bank stocks 1.9% higher on the day and 4.6% higher for the week.
However, Yellen has a lot in common with the Biden agenda. She favours more government fiscal spending, shares concern over labour market inequality, and was considered one of the most dovish FOMC members. As chair of the Fed, she even suggested that congress should give the central bank the authority to buy equities.
Loose monetary policy is good for stocks and will give Biden a workaround for his policies if Congress won’t cooperate, as he can apply executive orders with financial support from the Fed.
Down the road, this is embarking on untested Modern Monetary Theory, where the government takes over from the banks in deciding what gets spent and who gets to spend it. It is further confirmation that the government will practice Financial Repression, a time-tested method of inflating away the excesses of too much debt by holding interest rates below the level of inflation and GDP growth.
Conclusion
The market has had a pretty significant rally but nothing that isn’t consistent with what we have seen coming out of other recessions. Yet, in the short term, it’s overvalued and could react to negative news coming from a Covid lockdown. The election is behind us, which has resolved a major uncertainty with an acceptable resolution, especially since it appears to assure further monetary policy support.
What is still uncertain is the potential for a surprise coming in January from the Georgia Senate runoff and the stock market leadership in this next phase of the market. But a rotation to value or economically-sensitive companies would be consistent with what we have seen before.
In the meantime, November’s performance has been a reassuring shift in market sentiment.
When the Inmates Start Running the Asylum
Last fall, the market sold off sharply as Federal Reserve Chairman Powell suggested that the Central Bank was intent on raising interest rates further. Bad views for the economy and the stock market.
At the end of July, President Trump tweeted that he was going to introduce tariffs on another $300 billion of Chinese goods. The 10-year Treasury yield promptly dropped to 1.70%. Lower rates, good news, right? Nope. The market dropped over 6% in a week.
So, what gives, and who is setting interest rates?
Structural Bond Bear?
Each quarter, we write a commentary about the stock market which generally has a pretty near-term focus. In our most recent piece earlier this month, we reiterated a positive outlook for equities as long as a recession or tight monetary policy can be avoided.
However, if you step back from the day to day barrage of facts, there are some longer term factors and issues which we’ve identified and explored regarding the direction of interest rates and are monitoring in the context of the direction of the Fed’s policies and the economy.
