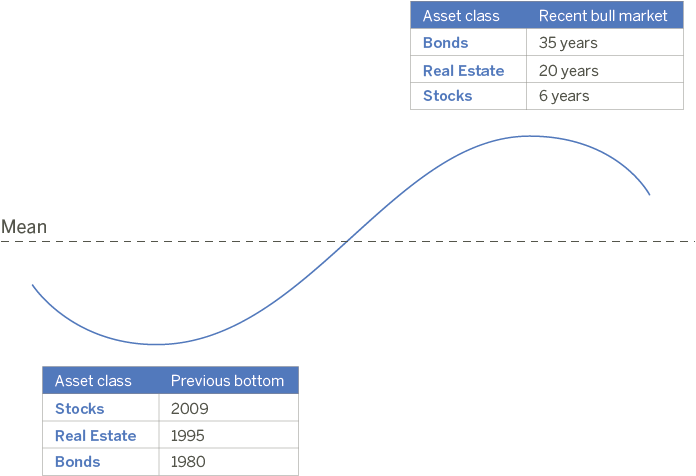
Greed can push market values to record highs and fear can drive them to new lows. But eventually, these trends change direction and market values revert to their long-term average or mean.
This pattern is repeated over and over again across decades and centuries. You see it with physical assets such as gold, oil and real estate as well as securities such as stocks and bonds.
This chart illustrates the long, arching trends of stocks, bonds and real estate over the past few decades. They have all seen highs and lows at different times. Astute investors sell when prices are above the mean and buy when they are below the mean.

Looking at today’s market, we see a number of cycles at or near inflection points. The bull market in stocks that began in 2009 may be losing steam. Bonds have risen for 35 years and may be due for a reversion. Gold and oil are well into reversing their long upward trends. And real estate may be set to do the same.
The Opportunity
At Cumberland, we draw on decades of investment experience to monitor the values of a wide variety of assets, both in absolute terms and relative to their historic cycles. It’s this experience—combined with a willingness to act—that has enabled our clients to consistently be in the right place at the right time.